

Question
Many of us may have a sweet tooth. Suppose you enjoy candy every now and then, but you want to be careful to not overdue
Many of us may have a sweet tooth. Suppose you enjoy candy every now and then, but you want to be careful to not overdue it on the calories. You go into a store and pick out a candy bar. You notice that the calories are not listed on the package. But, there are other variables listed for the candy bar like fat, carbs, sugar etc. Posted with this homework is a data set called CandyBars.jmp. The data set contains 75 different candies along with many variables on each type. Your goal is to find the variable that is most strongly related to calories.
(a) We will begin by looking at scatterplots of Calories versus a few variables. Use the data set and JMP to produce a scatterplot of Calories versus Total fat, Carbohydrate, Sugars, and Protein. Copy and paste your graphic to turn in with this homework. See the JMP guide for this section if you need any help with the commands. Note: Put Calories in first, then the other variables of interest. This way you only have to look at the top row.
(b) Find the scatterplot for Calories and Sugars. Interpret the scatterplot.
(c) Find the scatterplot for Calories and Total fat. Interpret the scatterplot.
(d) Based on all the scatterplots, which variable appears to have the strongest relationship with Calories? Why?
(e) Using the correlation values, what variable has the strongest correlation with Calories? What variable has the weakest correlation with Calories? What are the values of each correlation? Strongest variable: Correlation value: Weakest variable: Correlation value: 1 Linear Regression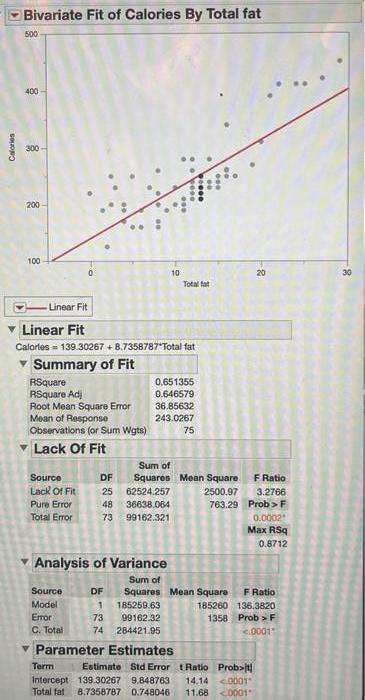
2. Now that we have found a variable with a strong linear relationship with Calories, we want to build a regression model that can ultimately allow us to predict the unknown calories of the candy bar in the beginning of this homework.
(a) Use JMP to get output for a regression using Total fat to predict the response variable Calories. Be sure to include a residual plot. Copy and paste and turn in the output with this homework. See the JMP guide for this section if you need any help with the commands.
(b) Report the regression equation.
(c) Interpret the slope value in the context of the problem. Note: The units for Total fat are grams.
(d) Interpret the intercept value in the context of the problem. Does the intercept interpretation make sense in context?
(e) A favorite of mine, Peanut Butter Twix has 16 grams of Total fat and 260 Calories. What is the residual value for this candy bar?
(f) Report and interpret the R2 value in context
(g) Suppose the original candy bar with calories missing in the beginning of the homework has a Total fat of 13 grams. Predict the amount of calories.
(h) Using the residual plot, is a linear model appropriate for investigating the relationship between Total fat and Calories in candy? Explain.
Calories Bivariate Fit of Calories By Total fat 500 400 300 200 ** ... 100- 0 10 20 Total fat Linear Fit Linear Fit Calories = 139.30267 + 8.7358787*Total fat Summary of Fit RSquare 0.651355 RSquare Adj 0.646579 Root Mean Square Error 36.85632 Mean of Response 243.0267 Observations (or Sum Wgts) 75 Lack Of Fit Sum of Source DF Squares Mean Square F Ratio Lack Of Fit 25 62524.257 2500.97 3.2766 Pure Error 48 36638.064 Total Error 73 99162.321 763.29 0.0002 Max RSq 0.8712 Prob>F Analysis of Variance Sum of Source Model Error: DF 1 185259.63 Squares Mean Square F Ratio 73 99162.32 185260 136.3820 1358 Prob F C. Total 74 284421.95 t Intercept 139.30267 9.848763 14.14 0001 Total fat 8.7358787 0.748046 11.68 0001
Step by Step Solution
There are 3 Steps involved in it
Step: 1
To answer Question 2 based on the provided data sheet lets break it down into the required subsections Note that since I dont have access to the Google Sheets data I will provide a detailed conceptual ...
Get Instant Access to Expert-Tailored Solutions
See step-by-step solutions with expert insights and AI powered tools for academic success
Step: 2

Step: 3
Ace Your Homework with AI
Get the answers you need in no time with our AI-driven, step-by-step assistance
Get Started
Precalculus Enhanced With Graphing Utilities
Authors: Michael Sullivan, Michael Sullivan III
7th Edition
0134268210, 9780134268217