

Answered step by step
Verified Expert Solution
Question
1 Approved Answer
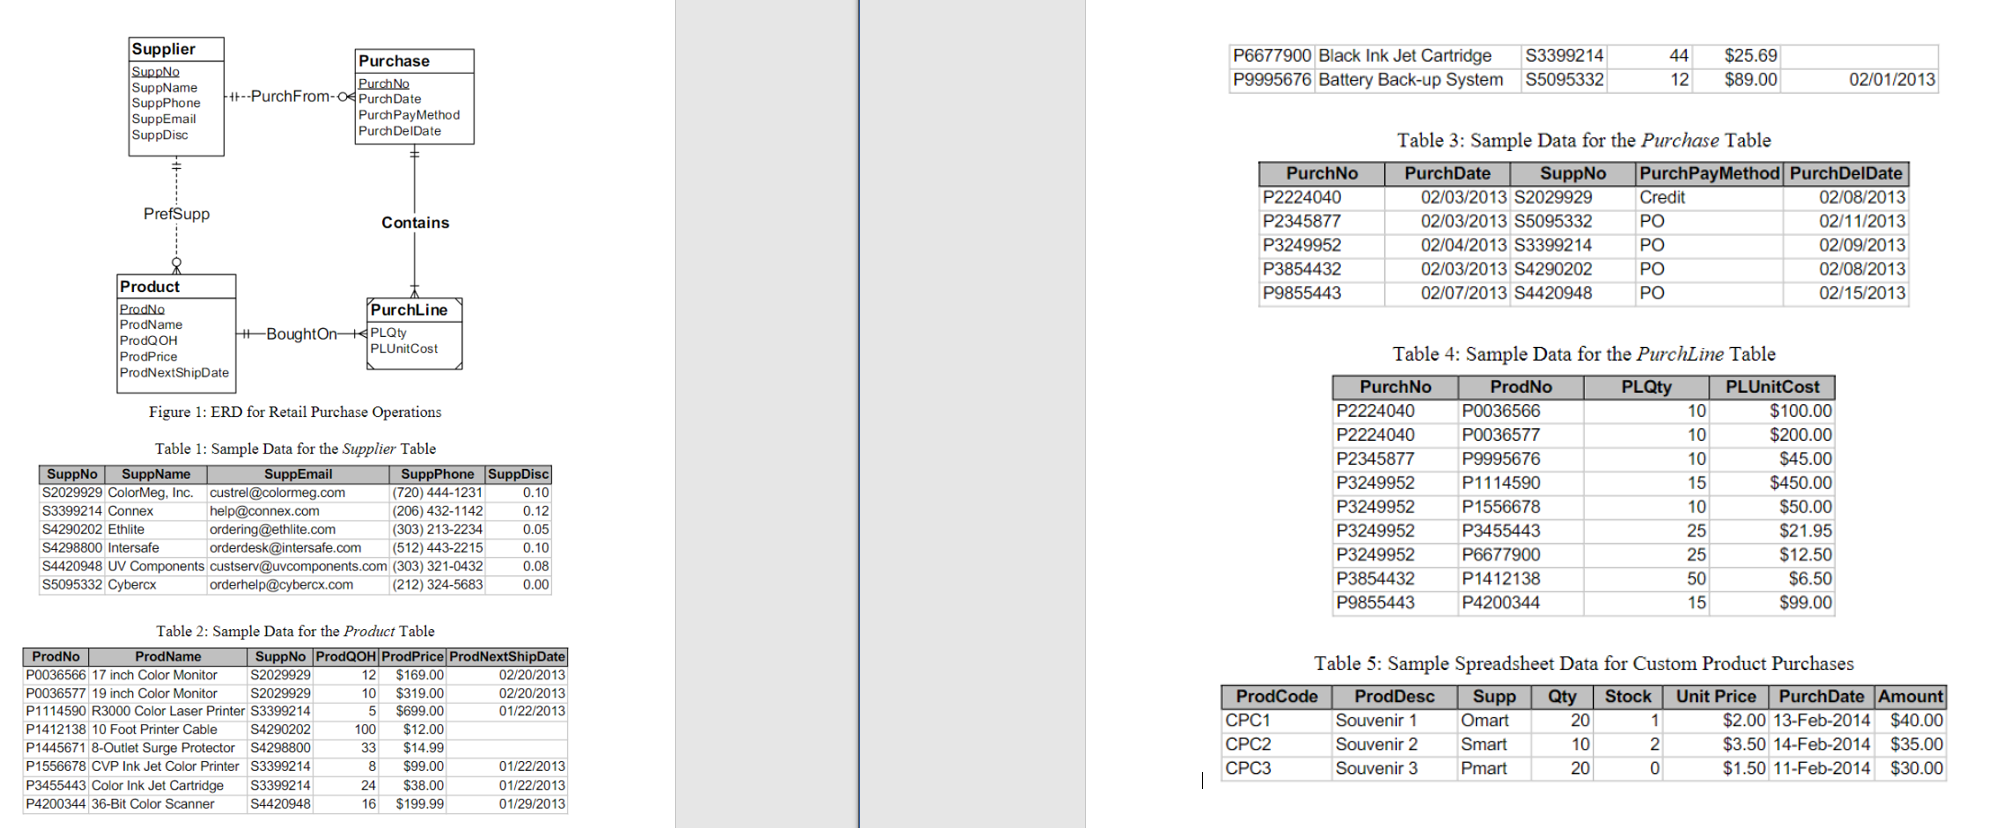
Data source size statistics: To compute grain size, you should use these estimates about cardinalities of tables and unique values of some columns. Product rows:
Data source size statistics:
To compute grain size, you should use these estimates about cardinalities of tables and
unique values of some columns.
Product rows:
Supplier rows:
Purchase rows: per year
PurchLine rows: per year
Spreadsheet rows: per month; new spreadsheet each month
Unique products in a spreadsheet for one year:
Unique suppliers in a spreadsheet for one year:
Business Needs:
The main purpose of the data warehouse is to track inventory balances over time.
Inventory balances are a type of snapshot. Snapshots are typical in applications in which
balances are involved, such as account balances in financial services, enrollment in courses,
reservations in hospitality and travel, and head count in personnel management. Snapshots
cannot be aggregated over time correctly. Summing quantities and values over time is not
meaningful.
The basic values for inventory tracking are quantity on hand and inventory value.
Inventory valuation can be complex as many accounting methods exist to value inventory. For
this case, the purchase price or unit cost of the inventory can be used for valuation. The data
warehouse should support detailed tracking of inventory to the individual product, purchased by
date, and supplier.
Here are typical computations for analyzing and tracking inventory balances using the
quantity on hand and inventory value:
The average quantities and stock values in each time period
The opening and closing balances for each time period
The change in inventory levels between consecutive periods and parallel periods
The minimum and maximum inventory levels in a time period
The relative contribution of the stocked item to the overall stock value
PLEASE ANSWER ALL OF THE QUESTIONS
Problems:
You should identify dimensions, map dimensions to data sources, and specify dimension
hierarchies. For each dimension, you should identify its data sources and attributes in each
data source. For hierarchical dimensions, you should indicate the levels from broad to
narrow.
You should specify measures, related data sources, and measure aggregation properties.
Identify the grain in your dimensional design using the business needs as a guideline. You
should then indicate relative storage requirements for the grain using the statistics for the data
sources. Using the cardinality estimates provided, you should determine either the fact table
size or sparsity and then compute the unknown grain size variable. For example, you should
compute sparsity if the fact table size is given.
Extend your analysis to design a star schema or variation to support inventory analysis. For
each table, you should define the table name, primary key, and columns. You do not need to
write complete CREATE TABLE statements.
Identify summarizability problems in your star schema and indicate preferred resolutions of
the summarizability problems. For incomplete dimensionfact relationships, you should also
indicate if columns in a dimension table allow null values.
You should populate your data warehouse tables based on the data in the sample tables and
spreadsheet. You do not need to write SQL INSERT statements or insert the data into your
tables. You can just show table listings in your solution. You should indicate mappings from
data sources into tables. For example, a mapping may involve generating new primary key
values for a data warehouse table or using a default value for a missing value.
Step by Step Solution
There are 3 Steps involved in it
Step: 1

Get Instant Access to Expert-Tailored Solutions
See step-by-step solutions with expert insights and AI powered tools for academic success
Step: 2

Step: 3
Ace Your Homework with AI
Get the answers you need in no time with our AI-driven, step-by-step assistance
Get Started
Structured Search For Big Data From Keywords To Key-objects
Authors: Mikhail Gilula
1st Edition
012804652X, 9780128046524