Data spreadsheet provided:
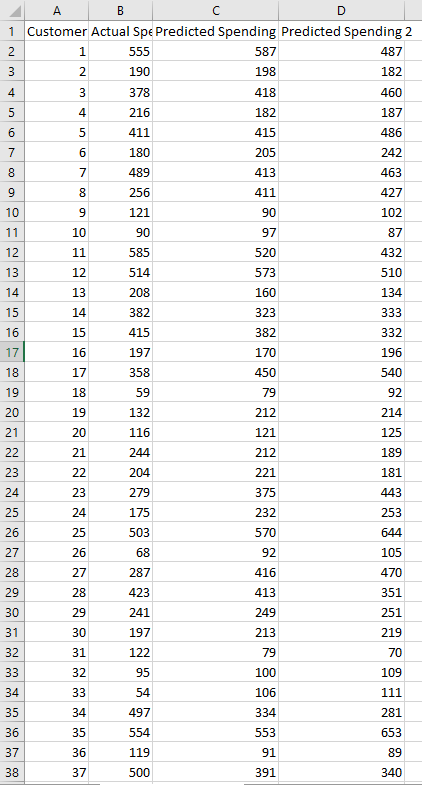
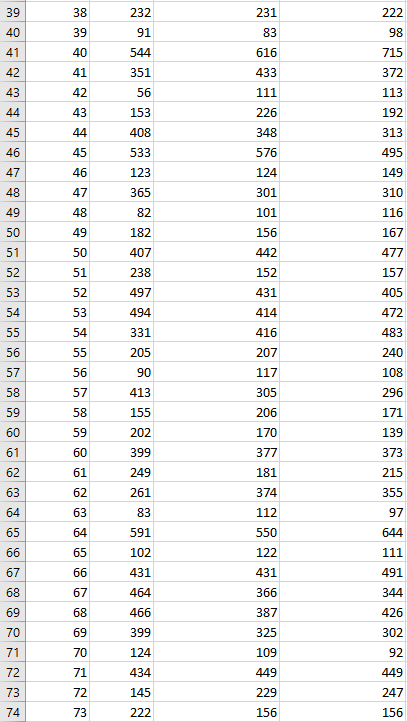
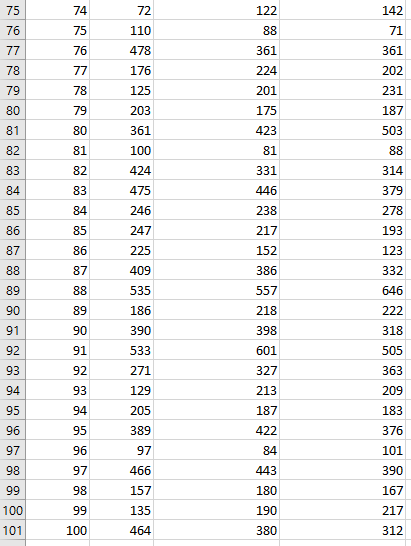
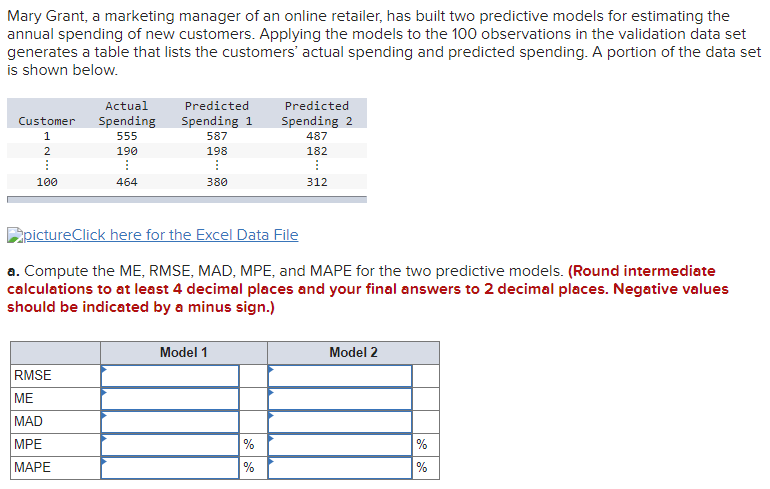
Mary Grant, a marketing manager of an online retailer, has built two predictive models for estimating the annual spending of new customers. Applying the models to the 100 observations in the validation data set generates a table that lists the customers' actual spending and predicted spending. A portion of the data set is shown below. Customer 1 Actual Spending 555 190 : 464 Predicted Spending 1 587 198 . 380 Predicted Spending 2 487 182 2 100 312 pictureClick here for the Excel Data File a. Compute the ME, RMSE, MAD, MPE, and MAPE for the two predictive models. (Round intermediate calculations to at least 4 decimal places and your final answers to 2 decimal places. Negative values should be indicated by a minus sign.) Model 1 Model 2 RMSE ME MAD MPE MAPE % % b. Are the predictive models over- or underestimating the actual selling price on average? The predictive models the actual spending c. Compare the RMSE and MAD of the two predictive models. Which predictive model performs better? is the better predictor. d-1. Compare the better-predictive model to a base model where every customer is predicted to have the average spending of the cases in the training data set, which is $290. Compute RMSE for the base model. (Round intermediate calculations to at least 4 decimal places and your final answer to 2 decimal places.) RMSE d-2. Does the better-predictive model built by Mary outperform the base model in terms of RMSE? The predictive models the base model 2 3 90 11 A B D 1 Customer Actual Spe Predicted Spending Predicted Spending 2 2 1 555 587 487 2 190 198 182 4 3 378 418 460 5 4 216 182 187 6 5 411 415 486 7 6 180 205 242 8 7 489 413 463 9 8 256 411 427 10 9 121 102 11 10 90 97 87 12 585 520 432 13 12 514 573 510 14 13 208 160 134 15 14 382 323 333 16 15 415 382 332 17 16 197 170 196 18 17 358 450 540 19 18 59 79 92 20 132 212 214 21 20 116 121 125 22 244 212 189 23 204 221 181 24 23 279 375 443 25 24 175 232 253 26 25 503 570 644 27 26 68 92 105 28 27 287 416 470 29 28 423 413 351 30 29 241 249 251 31 197 213 219 32 31 122 79 70 33 32 95 100 109 34 33 54 106 111 35 34 497 334 281 36 35 554 553 653 37 36 119 91 89 38 37 500 391 340 19 21 22 30 38 231 222 39 83 98 39 40 41 42 43 40 232 91 544 351 56 41 42 43 44 44 45 46 47 48 49 50 616 433 111 226 348 576 124 301 101 153 408 533 123 365 45 715 372 113 192 313 495 149 310 116 46 47 48 82 49 182 156 167 477 51 50 407 442 52 51 238 152 157 53 52 497 431 405 472 54 53 494 414 55 54 331 416 483 240 56 55 205 207 57 56 90 117 108 58 57 413 305 296 59 58 155 206 171 60 59 202 170 139 60 61 62 63 61 62 63 399 249 261 83 591 377 181 374 112 550 122 64 65 66 64 65 373 215 355 97 644 111 491 344 426 302 66 67 68 67 102 431 464 466 399 431 366 387 325 69 68 69 70 71 70 124 109 92 72 71 434 449 449 73 72 145 229 247 74 73 222 156 156 75 74 72 122 142 76 75 110 88 71 77 76 478 361 361 78 77 176 224 202 231 79 78 125 201 80 79 203 175 187 81 80 361 423 503 82 81 100 81 88 83 82 424 331 314 84 83 475 446 379 85 84 246 238 278 86 85 247 217 87 86 193 123 332 646 88 87 89 88 90 89 91 90 225 409 535 186 390 533 271 129 205 92 91 152 386 557 218 398 601 327 213 187 422 84 93 222 318 505 363 209 183 376 92 93 94 94 95 96 95 389 97 97 96 101 390 98 97 466 443 99 157 180 167 98 99 100 135 190 217 312 101 100 464 380 Mary Grant, a marketing manager of an online retailer, has built two predictive models for estimating the annual spending of new customers. Applying the models to the 100 observations in the validation data set generates a table that lists the customers' actual spending and predicted spending. A portion of the data set is shown below. Customer 1 Actual Spending 555 190 : 464 Predicted Spending 1 587 198 . 380 Predicted Spending 2 487 182 2 100 312 pictureClick here for the Excel Data File a. Compute the ME, RMSE, MAD, MPE, and MAPE for the two predictive models. (Round intermediate calculations to at least 4 decimal places and your final answers to 2 decimal places. Negative values should be indicated by a minus sign.) Model 1 Model 2 RMSE ME MAD MPE MAPE % % b. Are the predictive models over- or underestimating the actual selling price on average? The predictive models the actual spending c. Compare the RMSE and MAD of the two predictive models. Which predictive model performs better? is the better predictor. d-1. Compare the better-predictive model to a base model where every customer is predicted to have the average spending of the cases in the training data set, which is $290. Compute RMSE for the base model. (Round intermediate calculations to at least 4 decimal places and your final answer to 2 decimal places.) RMSE d-2. Does the better-predictive model built by Mary outperform the base model in terms of RMSE? The predictive models the base model 2 3 90 11 A B D 1 Customer Actual Spe Predicted Spending Predicted Spending 2 2 1 555 587 487 2 190 198 182 4 3 378 418 460 5 4 216 182 187 6 5 411 415 486 7 6 180 205 242 8 7 489 413 463 9 8 256 411 427 10 9 121 102 11 10 90 97 87 12 585 520 432 13 12 514 573 510 14 13 208 160 134 15 14 382 323 333 16 15 415 382 332 17 16 197 170 196 18 17 358 450 540 19 18 59 79 92 20 132 212 214 21 20 116 121 125 22 244 212 189 23 204 221 181 24 23 279 375 443 25 24 175 232 253 26 25 503 570 644 27 26 68 92 105 28 27 287 416 470 29 28 423 413 351 30 29 241 249 251 31 197 213 219 32 31 122 79 70 33 32 95 100 109 34 33 54 106 111 35 34 497 334 281 36 35 554 553 653 37 36 119 91 89 38 37 500 391 340 19 21 22 30 38 231 222 39 83 98 39 40 41 42 43 40 232 91 544 351 56 41 42 43 44 44 45 46 47 48 49 50 616 433 111 226 348 576 124 301 101 153 408 533 123 365 45 715 372 113 192 313 495 149 310 116 46 47 48 82 49 182 156 167 477 51 50 407 442 52 51 238 152 157 53 52 497 431 405 472 54 53 494 414 55 54 331 416 483 240 56 55 205 207 57 56 90 117 108 58 57 413 305 296 59 58 155 206 171 60 59 202 170 139 60 61 62 63 61 62 63 399 249 261 83 591 377 181 374 112 550 122 64 65 66 64 65 373 215 355 97 644 111 491 344 426 302 66 67 68 67 102 431 464 466 399 431 366 387 325 69 68 69 70 71 70 124 109 92 72 71 434 449 449 73 72 145 229 247 74 73 222 156 156 75 74 72 122 142 76 75 110 88 71 77 76 478 361 361 78 77 176 224 202 231 79 78 125 201 80 79 203 175 187 81 80 361 423 503 82 81 100 81 88 83 82 424 331 314 84 83 475 446 379 85 84 246 238 278 86 85 247 217 87 86 193 123 332 646 88 87 89 88 90 89 91 90 225 409 535 186 390 533 271 129 205 92 91 152 386 557 218 398 601 327 213 187 422 84 93 222 318 505 363 209 183 376 92 93 94 94 95 96 95 389 97 97 96 101 390 98 97 466 443 99 157 180 167 98 99 100 135 190 217 312 101 100 464 380