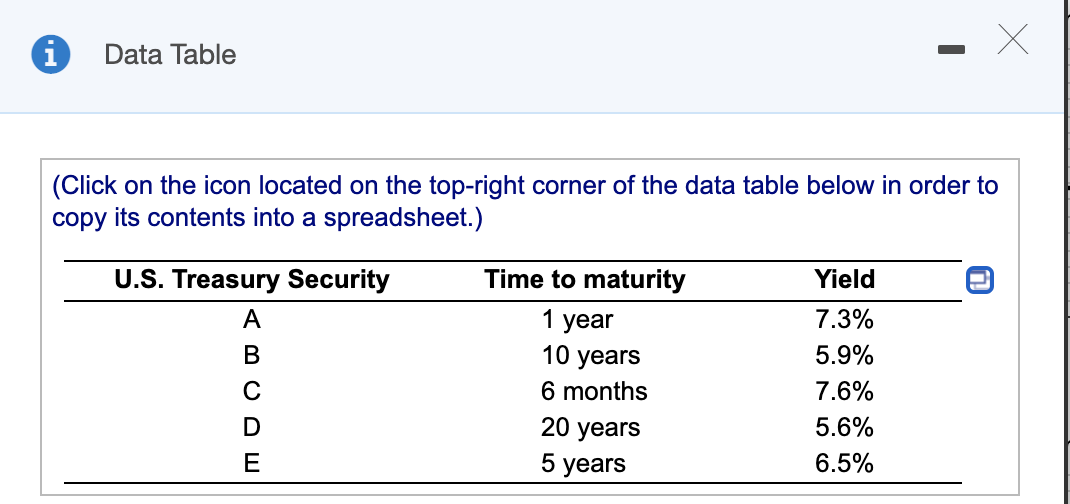
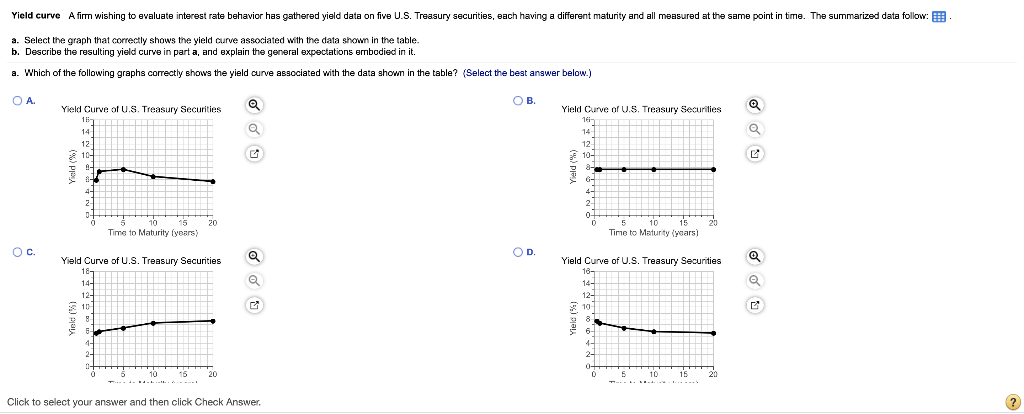
Data Table (Click on the icon located on the top-right corner of the data table below in order to copy its contents into a spreadsheet.) Time to maturity Yield U.S. Treasury Security A 1 year 10 years B 6 months 7.3% 5.9% 7.6% 5.6% 6.5% D 20 years 5 years E Yield curve A firm wishing to evaluate interest rate behavior has gathered yield data on five U.S. Treasury securities, each having a different maturity and all measured at the same point in time. The summarized data follow: a. Select the graph that correctly shows the yield curve associated with the data shown in the table. b. Describe the resulting yield curve in part a, and explain the general expectations embodied in it. a. Which of the following graphs correctly shows the yield curve associated with the data shown in the table? (Select the best answer below.) OA OB. Yield Curve of U.S. Treasury Securities 157 14 12 2 10- Yield Curve of U.S. Treasury Securities 16 14 12 10- Q 8- 4 4- 2 6- 4- 2 0 D 20 20 10 15 Time to Maturity (years) 10 15 Time to Maturity (years) OC. OD. Yield Curve of U.S. Treasury Securities 1& 14-1 12-14 10 @ Yield Curve of U.S. Treasury Securities 18- 14- 12- 10 8 6- 4- 1- 10 20 0 5 10 15 20 Click to select your answer and then click Check Answer. ? Data Table (Click on the icon located on the top-right corner of the data table below in order to copy its contents into a spreadsheet.) Time to maturity Yield U.S. Treasury Security A 1 year 10 years B 6 months 7.3% 5.9% 7.6% 5.6% 6.5% D 20 years 5 years E Yield curve A firm wishing to evaluate interest rate behavior has gathered yield data on five U.S. Treasury securities, each having a different maturity and all measured at the same point in time. The summarized data follow: a. Select the graph that correctly shows the yield curve associated with the data shown in the table. b. Describe the resulting yield curve in part a, and explain the general expectations embodied in it. a. Which of the following graphs correctly shows the yield curve associated with the data shown in the table? (Select the best answer below.) OA OB. Yield Curve of U.S. Treasury Securities 157 14 12 2 10- Yield Curve of U.S. Treasury Securities 16 14 12 10- Q 8- 4 4- 2 6- 4- 2 0 D 20 20 10 15 Time to Maturity (years) 10 15 Time to Maturity (years) OC. OD. Yield Curve of U.S. Treasury Securities 1& 14-1 12-14 10 @ Yield Curve of U.S. Treasury Securities 18- 14- 12- 10 8 6- 4- 1- 10 20 0 5 10 15 20 Click to select your answer and then click Check