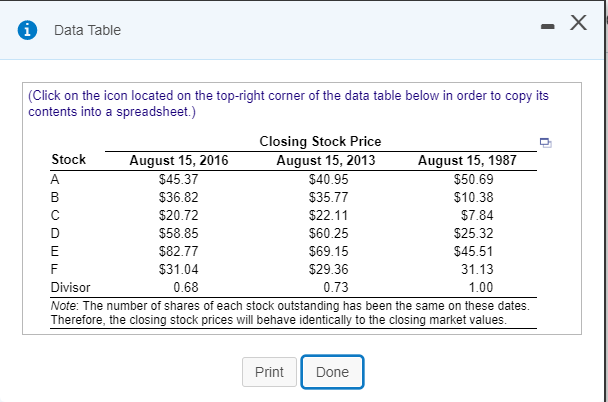
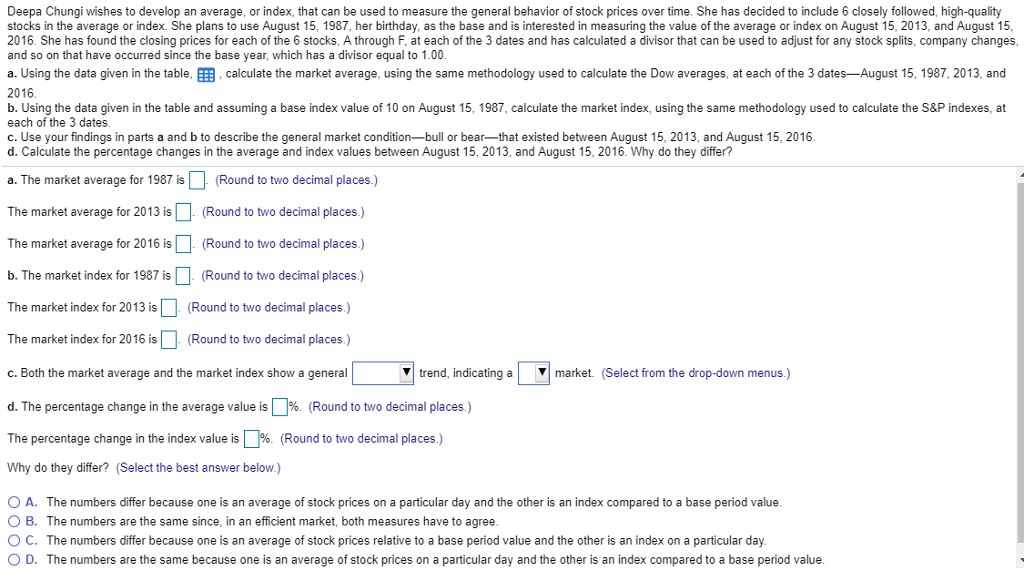
Data Table (Click on the icon located on the top-right corner of the data table below in order to copy its contents into a spreadsheet.) Closing Stock Price Stock August 15, 2016 $45.37 $36.82 $20.72 $58.85 $82.77 $31.04 August 15, 2013 $40.95 $35.77 $22.11 $60.25 $69.15 $29.36 0.73 August 15, 1987 $50.69 $10.38 $7.84 $25.32 $45.51 31.13 1.00 Divisor 0.68 Note: The number of shares of each stock outstanding has been the same on these dates. Therefore, the closing stock prices will behave identically to the closing market values Print Done Deepa Chungi wishes to develop an average, or index, that can be used to measure the general behavior of stock prices over time. She has decided to include 6 closely followed, high-quality stocks in the average or index. She plans to use August 15, 1987, her birthday, as the base and is interested in measuring the value of the average or index on August 15, 2013, and August 15 2016. She has found the closing prices for each of the 6 stocks, A through F, at each of the 3 dates and has calculated a divisor that can be used to adjust for any stock splits, company changes, and so on that have occurred since the base year, which has a divisor equal to 1.00 a. Using the data given in the table calculate the market average using the same methodology used to calculate the Dow averages, at each of the 3 dates August 15 1987, 2013, and 2016 b. Using the data given in the table and assuming a base index value of 10 on August 15, 1987, calculate the market index, using the same methodology used to calculate the S&P indexes, at each of the 3 dates c. Use your findings in parts a and b to describe the general market condition-bull or bear-that existed between August 15, 2013, and August 15, 2016 d. Calculate the percentage changes in the average and index values between August 15, 2013, and August 15, 2016. Why do they differ? a. The market average for 1987 is(Round to two decimal places.) The market average for 2013 isRound to two decimal places) The market average for 2016 is (Round to two decimal places.) b. The market index for 1987is(Round to two decimal places) The market index for 2013 is (Round to two decimal places.) The market index for 2016 is(Round to two decimal places) c. Both the market average and the market index show a general d. The percentage change in the average value is%. (Round to two decimal places.) The percentage change in the index value is 96 (Round to two decimal places ) Why do they differ? (Select the best answer below.) Vtrend, indicating amarket. (Select from the drop-down menus.) A. The numbers differ because one is an average of stock prices on a particular day and the other is an index compared to a base period value O B. The numbers are the same since, in an efficient market, both measures have to agree O C. The numbers differ because one is an average of stock prices relative to a base period value and the other is an index on a particular day O D. The numbers are the same because one is an average of stock prices on a particular day and the other is an index compared to a base period value