Question
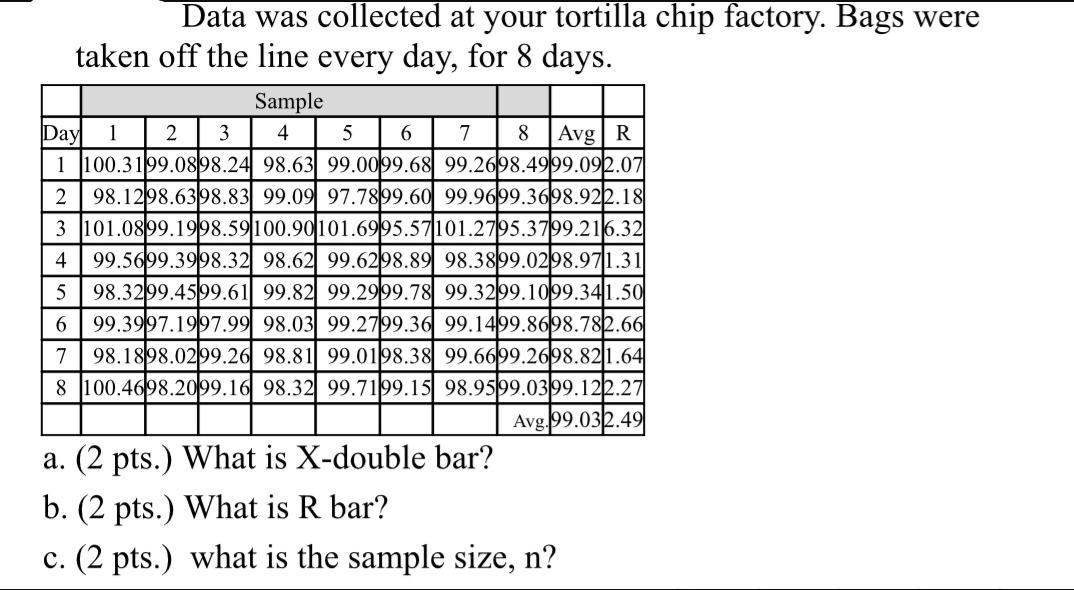
Data was collected at your tortilla chip factory. Bags were taken off the line every day, for 8 days. Sample 4 Day 1 2

Data was collected at your tortilla chip factory. Bags were taken off the line every day, for 8 days. Sample 4 Day 1 2 3 5 6 7 8 Avg R 1 100.3199.0898.24 98.63 99.0099.68 99.2698.4999.092.07 3 2 98.1298.6398.83 99.09 97.7899.60 99.9699.3698.922.18 101.0899.1998.59100.90101.6995.57101.2795.3799.216.32 4 99.5699.3998.32 98.62 99.6298.89 98.3899.0298.971.31 5 98.3299.4599.61 99.82 99.2999.78 99.3299.1099.341.50 6 99.3997.1997.99 98.03 99.2799.36 99.1499.8698.782.66 7 98.1898.0299.26 98.81 99.0198.38 99.6699.2698.821.64 8 100.4698.2099.16 98.32 99.7199.15 98.9599.0399.122.27 Avg.99.032.49 a. (2 pts.) What is X-double bar? b. (2 pts.) What is R bar? c. (2 pts.) what is the sample size, n?
Step by Step Solution
3.48 Rating (148 Votes )
There are 3 Steps involved in it
Step: 1
SOLUTION a The Xdouble bar X represents the sample mean which is the average of all the individual o...
Get Instant Access to Expert-Tailored Solutions
See step-by-step solutions with expert insights and AI powered tools for academic success
Step: 2

Step: 3

Ace Your Homework with AI
Get the answers you need in no time with our AI-driven, step-by-step assistance
Get StartedRecommended Textbook for
Income Tax Fundamentals 2013
Authors: Gerald E. Whittenburg, Martha Altus Buller, Steven L Gill
31st Edition
1111972516, 978-1285586618, 1285586611, 978-1285613109, 978-1111972516
Students also viewed these General Management questions
Question
Answered: 1 week ago
Question
Answered: 1 week ago
Question
Answered: 1 week ago
Question
Answered: 1 week ago
Question
Answered: 1 week ago
Question
Answered: 1 week ago
Question
Answered: 1 week ago
Question
Answered: 1 week ago
Question
Answered: 1 week ago
Question
Answered: 1 week ago
Question
Answered: 1 week ago
Question
Answered: 1 week ago
Question
Answered: 1 week ago
Question
Answered: 1 week ago
Question
Answered: 1 week ago
Question
Answered: 1 week ago
Question
Answered: 1 week ago
Question
Answered: 1 week ago
Question
Answered: 1 week ago
Question
Answered: 1 week ago
Question
Answered: 1 week ago
Question
Answered: 1 week ago
Question
Answered: 1 week ago
View Answer in SolutionInn App


