DataPoint Engineering is considering the purchase of a new piece of equipment for $220,000. It has an eight-year midpoint of its asset depreciation range (ADR). It will require an additional initial investment of $120,000 in nondepreciable working capital. $30,000 of this investment will be recovered after the sixth year and will provide additional cash flow for that year. Income before depreciation and taxes for the next six are shown in the following table. Use Table 1211, Table 1212. Use Appendix B for an approximate answer but calculate your final answer using the formula and financial calculator methods.
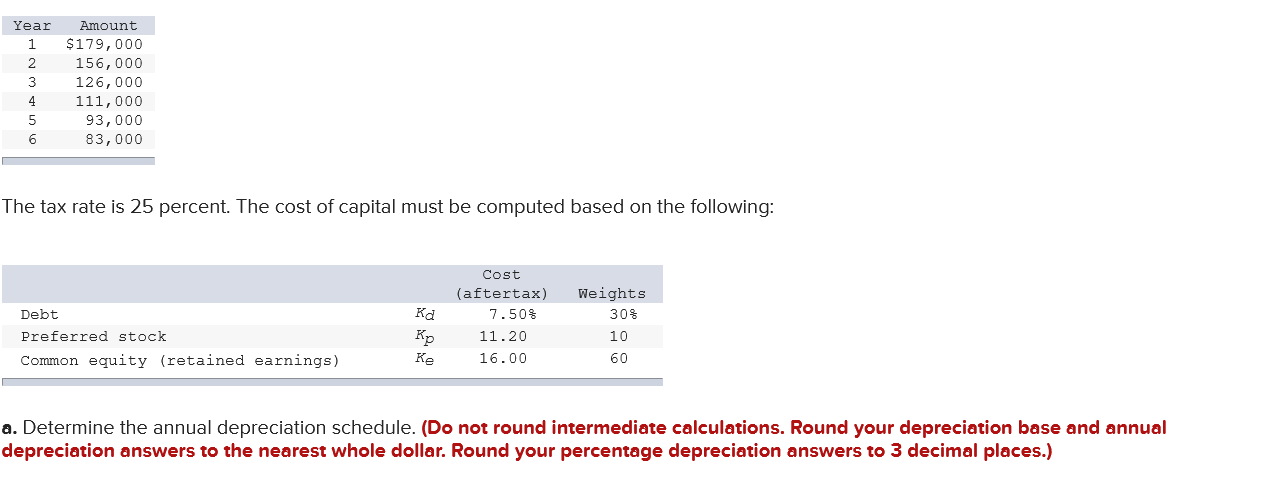
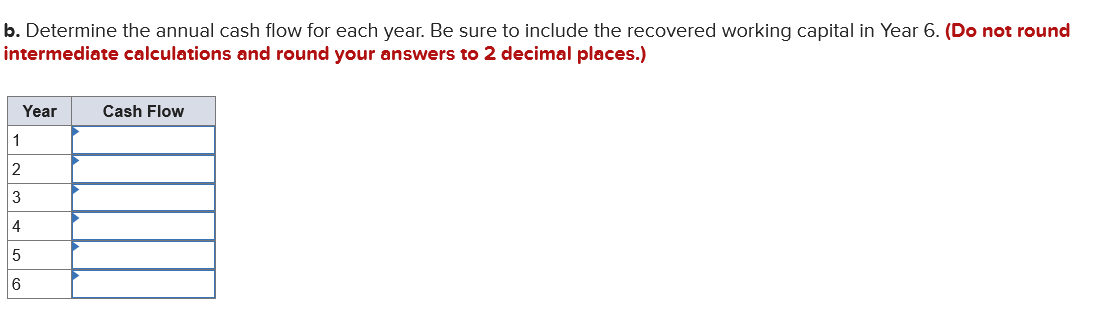
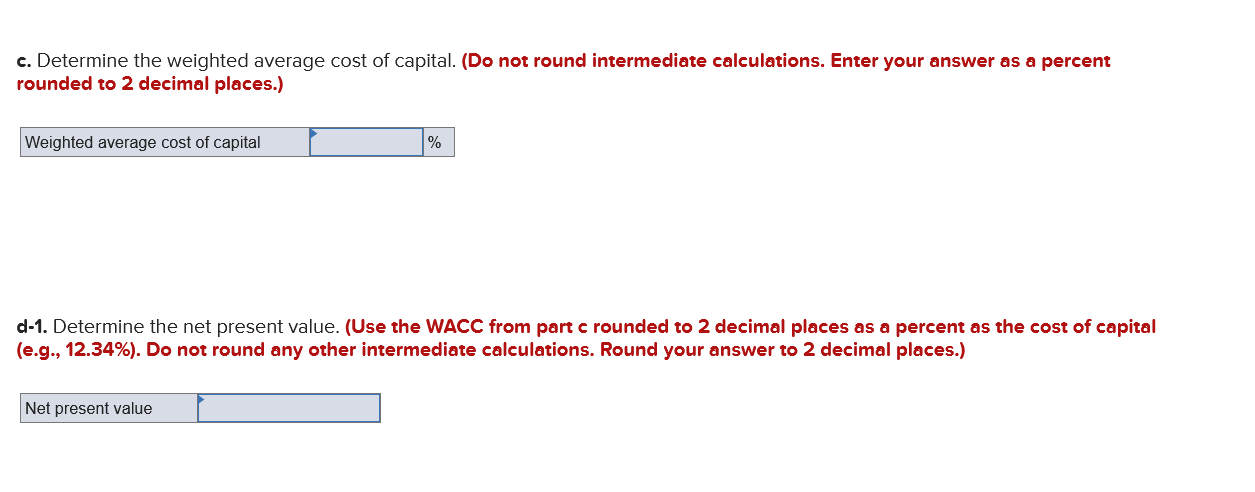
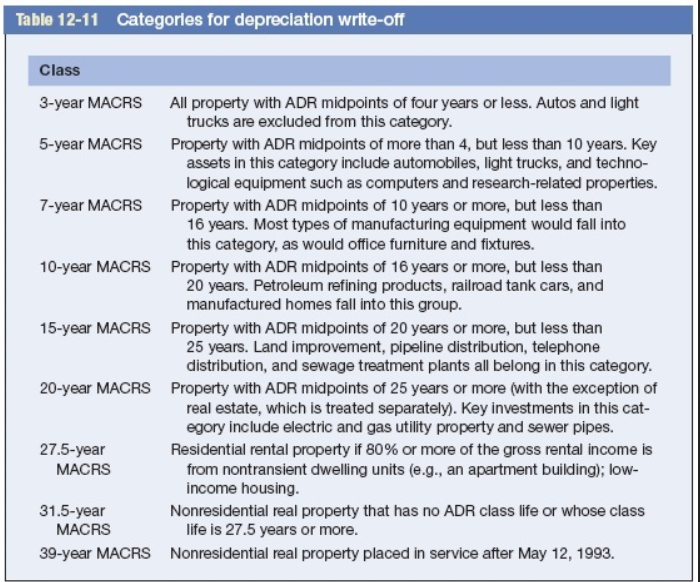
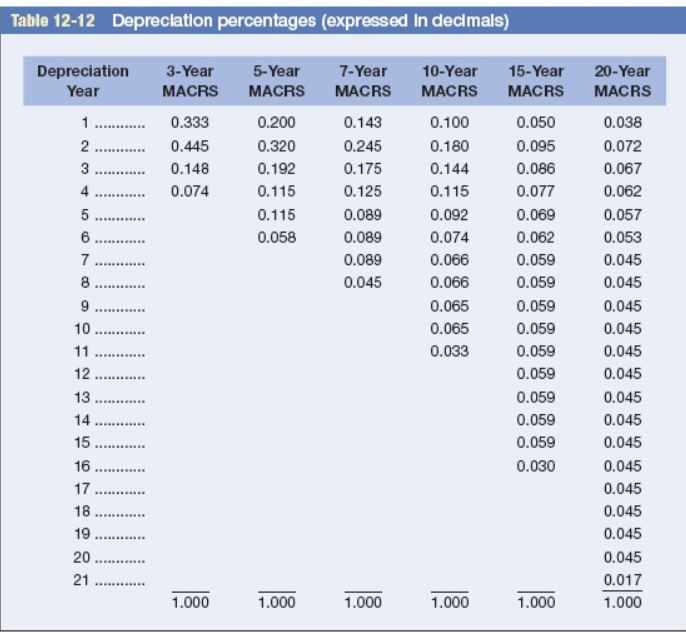
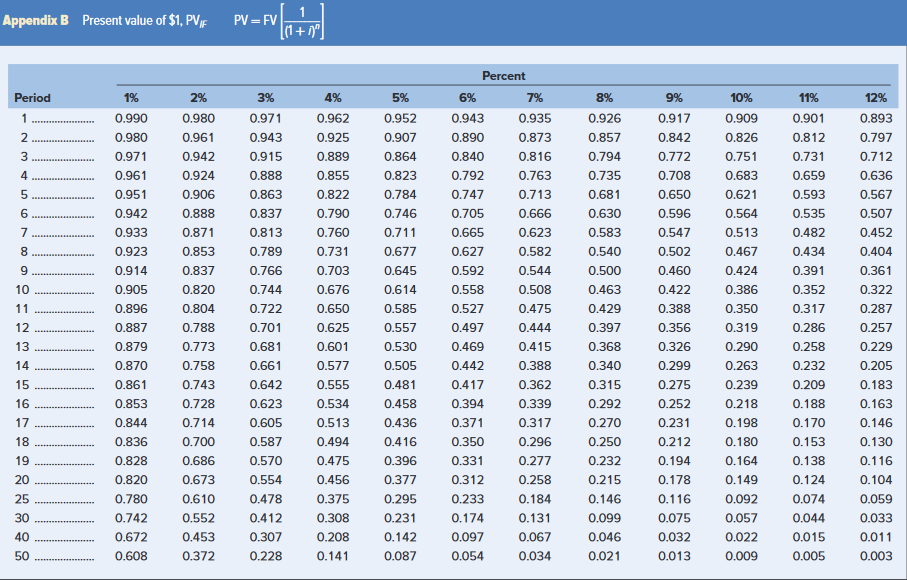
Year 1 2 3 4 5 6 Amount $179,000 156,000 126,000 111,000 93,000 83,000 The tax rate is 25 percent. The cost of capital must be computed based on the following: Debt Preferred stock Common equity (retained earnings) Kd Cost (aftertax) 7.50% 11.20 16.00 Weights 30% 10 60 a. Determine the annual depreciation schedule. (Do not round intermediate calculations. Round your depreciation base and annual depreciation answers to the nearest whole dollar. Round your percentage depreciation answers to 3 decimal places.) b. Determine the annual cash flow for each year. Be sure to include the recovered working capital in Year 6. (Do not round intermediate calculations and round your answers to 2 decimal places.) Year Cash Flow 1 2 3 4 5 6 c. Determine the weighted average cost of capital. (Do not round intermediate calculations. Enter your answer as a percent rounded to 2 decimal places.) Weighted average cost of capital % d-1. Determine the net present value. (Use the WACC from part c rounded to 2 decimal places as a percent as the cost of capital (e.g., 12.34%). Do not round any other intermediate calculations. Round your answer to 2 decimal places.) Net present value Table 12-11 Categories for depreciation write-off Class 3-year MACRS All property with ADR midpoints of four years or less. Autos and light trucks are excluded from this category. 5-year MACRS Property with ADR midpoints of more than 4, but less than 10 years. Key assets in this category include automobiles, light trucks, and techno- logical equipment such as computers and research-related properties. 7-year MACRS Property with ADR midpoints of 10 years or more, but less than 16 years. Most types of manufacturing equipment would fall into this category, as would office furniture and fixtures. 10-year MACRS Property with ADR midpoints of 16 years or more, but less than 20 years. Petroleum refining products, railroad tank cars, and manufactured homes fall into this group. 15-year MACRS Property with ADR midpoints of 20 years or more, but less than 25 years. Land improvement, pipeline distribution, telephone distribution, and sewage treatment plants all belong in this category. 20-year MACRS Property with ADR midpoints of 25 years or more (with the exception of real estate, which is treated separately). Key investments in this cat- egory include electric and gas utility property and sewer pipes. 27.5-year Residential rental property if 80% or more of the gross rental income is MACRS from nontransient dwelling units (e.g., an apartment building); low- income housing. 31.5-year Nonresidential real property that has no ADR class life or whose class MACRS life is 27.5 years or more. 39-year MACRS Nonresidential real property placed in service after May 12, 1993. Table 12-12 Depreciation percentages (expressed in decimals) Depreciation Year 15-Year MACRS 3-Year MACRS 0.333 0.445 0.148 0.074 5-Year MACRS 0.200 0.320 0.192 0.115 0.115 0.058 1 2 3 4 5 6 7 8 7-Year MACRS 0.143 0.245 0.175 0.125 0.089 0.089 0.089 0.045 RE 10-Year MACRS 0.100 0.180 0.144 0.115 0.092 0.074 0.066 0.066 0.065 0.065 0.033 0.050 0.095 0.086 0.077 0.069 0.062 0.059 0.059 0.059 0.059 0.059 0.059 0.059 0.059 0.059 0.030 10 20-Year MACRS 0.038 0.072 0.067 0.062 0.057 0.053 0.045 0.045 0.045 0.045 0.045 0.045 0.045 0.045 0.045 0.045 0.045 0.045 0.045 0.045 0.017 1.000 11 ............ 12 13 14 15 ........ 16 17 18 19 20 ........... 21 1.000 1.000 1.000 1.000 1.000 Appendix B Present value of $1, PVF PV = FV ((1+1)") Percent Period 3% 5% 6% 7% 8% 10% 11% 12% 1 2 3 4 1% 0.990 0.980 0.971 0.961 2% 0.980 0.961 0.942 0.924 0.906 0.971 0.943 0.915 0.888 0.863 0.837 9% 0.917 0.842 0.772 0.708 0.909 0.826 0.751 0.683 0.621 0.564 0.943 0.890 0.840 0.792 0.747 0.705 0.665 0.627 0.592 0.901 0.812 0.731 0.659 0.593 0.893 0.797 0.712 0.636 0.567 0.507 5 0.951 0.650 6 0.942 0.888 0.596 0.535 7 0.813 0.513 0.482 0.452 8 9 0.547 0.502 0.460 0.434 0.391 10 0.558 0.422 0.352 0.527 11 12 4% 0.962 0.925 0.889 0.855 0.822 0.790 0.760 0.731 0.703 0.676 0.650 0.625 0.601 0.577 0.555 0.534 0.513 0.494 0.475 0.456 0.375 0.308 0.208 0.141 0.952 0.907 0.864 0.823 0.784 0.746 0.711 0.677 0.645 0.614 0.585 0.557 0.530 0.505 0.481 0.458 0.436 0.416 0.396 0.377 0.295 0.231 0.142 0.087 0.933 0.923 0.914 0.905 0.896 0.887 0.879 0.870 0.861 0.853 0.844 0.836 0.828 0.820 0.780 0.742 0.672 0.608 13 0.871 0.853 0.837 0.820 0.804 0.788 0.773 0.758 0.743 0.728 0.714 0.700 0.686 0.673 0.610 0.552 0.453 0.372 0.388 0.356 0.326 0.299 0.275 0.935 0.873 0.816 0.763 0.713 0.666 0.623 0.582 0.544 0.508 0.475 0.444 0.415 0.388 0.362 0.339 0.317 0.296 0.277 0.258 0.184 0.131 0.067 0.034 14 0.926 0.857 0.794 0.735 0.681 0.630 0.583 0.540 0.500 0.463 0.429 0.397 0.368 0.340 0.315 0.292 0.270 0.250 0.232 0.215 0.146 0.099 0.046 0.021 0.789 0.766 0.744 0.722 0.701 0.681 0.661 0.642 0.623 0.605 0.587 0.570 0.554 0.478 0.412 0.307 0.228 15 16 0.497 0.469 0.442 0.417 0.394 0.371 0.350 0.331 0.312 0.233 0.174 0.097 0.054 0.252 0.467 0.424 0.386 0.350 0.319 0.290 0.263 0.239 0.218 0.198 0.180 0.164 0.149 0.092 0.057 0.022 0.009 17 18 19 20 25 30 0.404 0.361 0.322 0.287 0.257 0.229 0.205 0.183 0.163 0.146 0.130 0.116 0.104 0.059 0.033 0.011 0.003 0.317 0.286 0.258 0.232 0.209 0.188 0.170 0.153 0.138 0.124 0.074 0.044 0.015 0.005 0.231 0.212 0.194 0.178 0.116 0.075 40 0.032 50 0.013