

Answered step by step
Verified Expert Solution
Question
1 Approved Answer
Dataset: 6, 2, 8, 7, 6, 12, 6, 5, 4, 5 Mode: ___ Median: ___ Mean: ___ Range: ___ Variance: ___ Standard deviation: ___ INSTRUCTIONS
Dataset: 6, 2, 8, 7, 6, 12, 6, 5, 4, 5
- Mode: ___
- Median: ___
- Mean: ___
- Range: ___
- Variance: ___
- Standard deviation: ___
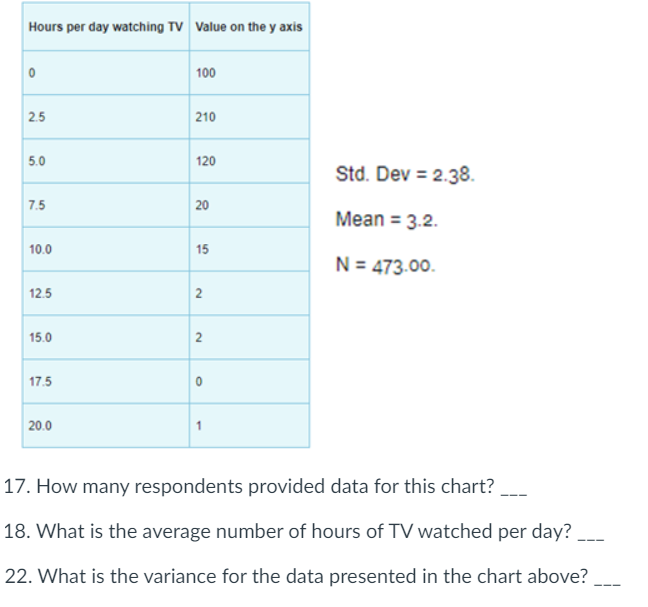
INSTRUCTIONS: Use the frequency table below to calculate the median.
- Median: ___
Step by Step Solution
There are 3 Steps involved in it
Step: 1

Get Instant Access to Expert-Tailored Solutions
See step-by-step solutions with expert insights and AI powered tools for academic success
Step: 2

Step: 3
Ace Your Homework with AI
Get the answers you need in no time with our AI-driven, step-by-step assistance
Get Started
Income Tax Fundamentals 2013
Authors: Gerald E. Whittenburg, Martha Altus Buller, Steven L Gill
31st Edition
1111972516, 978-1285586618, 1285586611, 978-1285613109, 978-1111972516