Answered step by step
Verified Expert Solution
Link Copied!

Question

1 Approved Answer

Datasetcoke.dtacontains the choice between Coke and Pepsi by 1140 shoppers from scanner data. The variable pratio represents the relative price of Coke compared to Pepsi?for

Datasetcoke.dtacontains the choice between Coke and Pepsi by 1140 shoppers from scanner data. The variablepratiorepresents the relative price of Coke compared to Pepsi?for example, if pratio=1.1, it indicates that the price of Coke was 10% higher than that of Pepsi.Disp_Cokeanddisp_pepsiare indicator variables if the product was on special display at the time of the purchase.

(a) Estimate a model that predicts the probability of purchasing Coke (Coke==1) as a function of price ratio and display (both Coke and Pepsi).

Does anyone know how i can answer (a) what kind of script do i have to use in R studio?
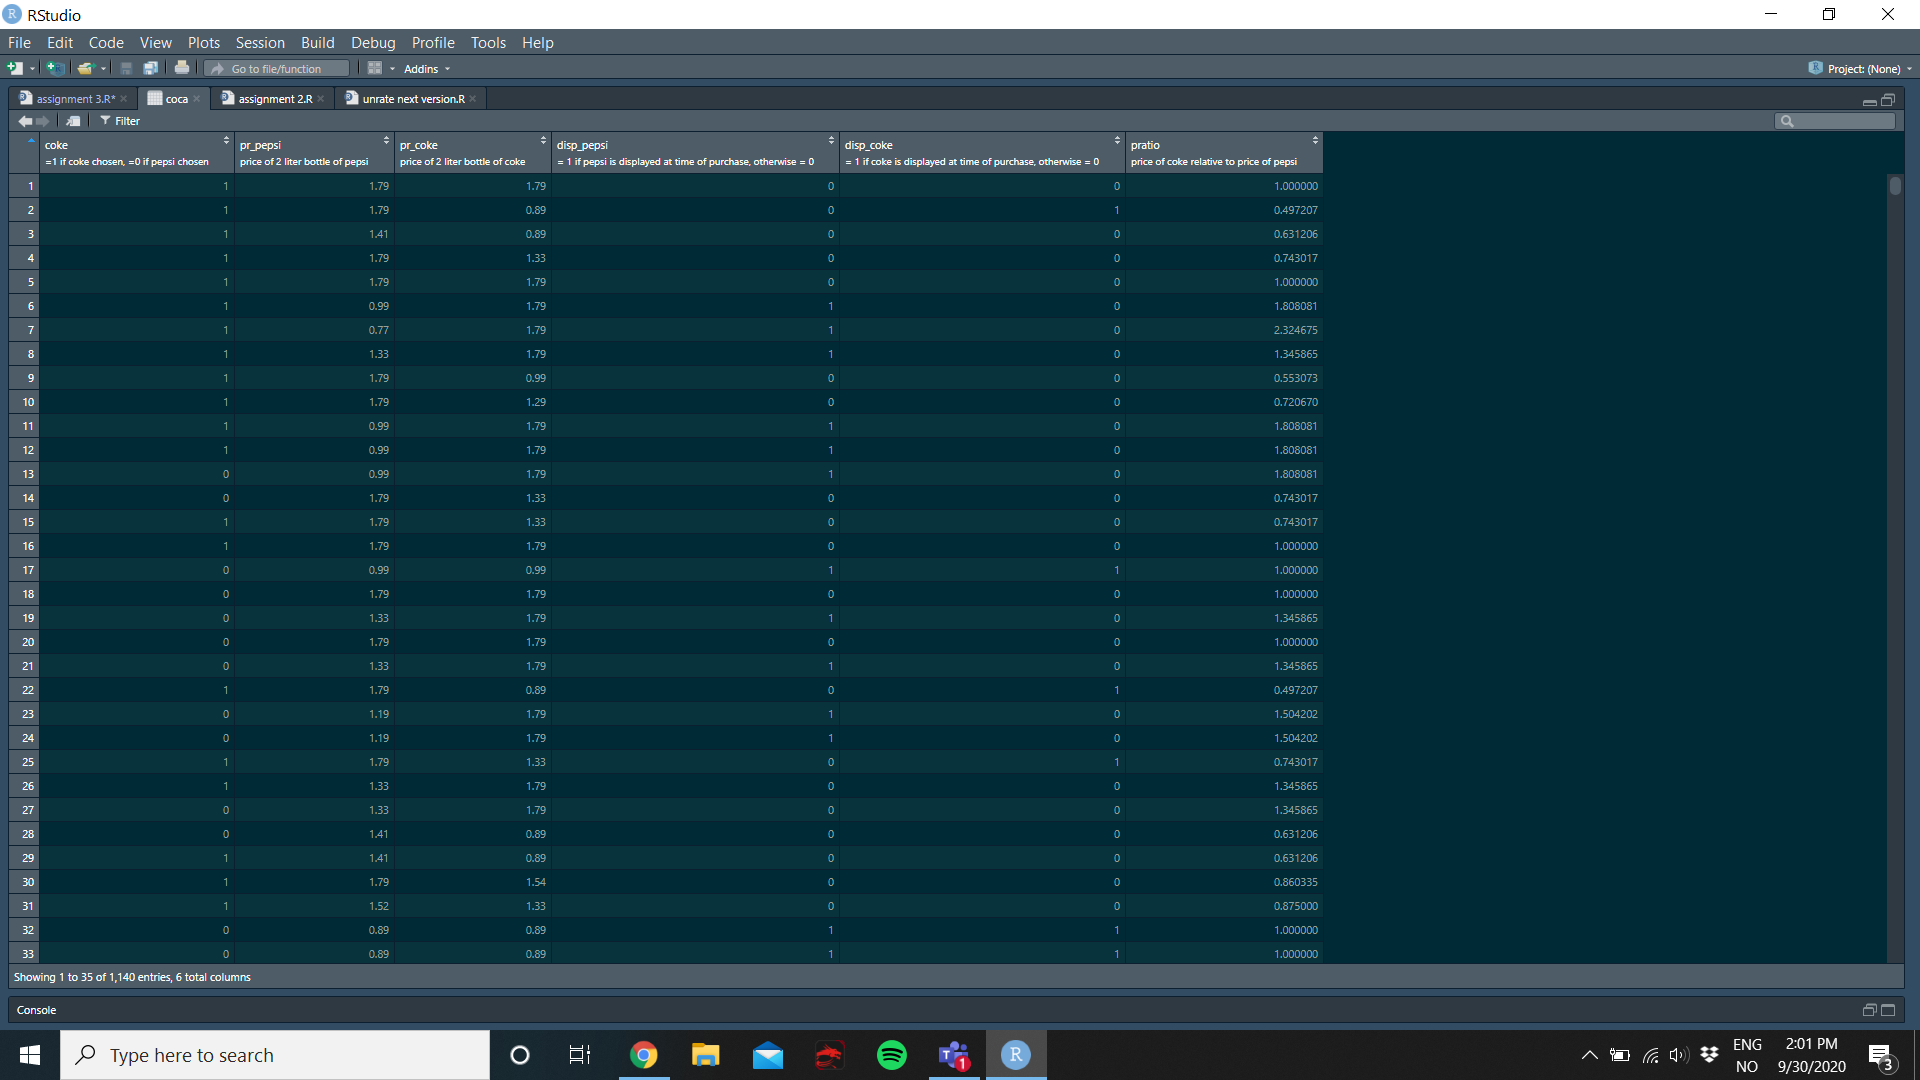
image text in transcribed
R RStudio X File Edit Code View Plots Session Build Debug Profile Tools Help + +R Go to file/function . Addins R Project: (None) ~ assignment 3.R* x coca assignment 2.R x Punrate next version.R T Filter Q coke pr_pepsi pr_coke =1 if coke chosen, =0 if pepsi chosen disp_pepsi price of 2 liter bottle of pepsi disp_coke price of 2 liter bottle of coke pratio = 1 if pepsi is displayed at time of purchase, otherwise = 0 = 1 if coke is displayed at time of purchase, otherwise = 0 price of coke relative to price of pepsi 1.79 1.79 0 1.000000 1.79 0.89 0.497207 1.41 0.89 0.631206 1.79 1.33 0.743017 1.79 1.79 1.000000 0.99 1.79 0 1.808081 0.77 1.79 2.324675 1.33 1.79 1.345865 1.79 0.99 0.553073 1.79 1.29 0.720670 0.99 1.79 1.808081 0.99 1.79 1.80808 0.99 1.79 1.808081 1.79 1.33 b.743017 1.79 1.33 0.743017 1.79 1.79 1.000000 0.99 0.99 1.000000 1.79 1.79 1.000000 1.33 1.79 1.345865 1.79 1.79 1.000000 1.33 1.79 1.345865 1.79 0.89 0.497207 1.19 1.79 1.504202 1.19 1.79 1.79 1.33 1.33 1.79 O 1.504202 0.743017 1.345865 1.33 1.79 1.345865 1.41 0.89 0.631206 1.41 0.89 0.631206 1.79 1.54 0.860335 1.52 1.33 0.875000 0.89 0.89 1.000000 0.89 0.89 1.000000 Showing 1 to 35 of 1,140 entries, 6 total columns Console Type here to search O R ENG 2:01 PM NO 9/30/2020

Step by Step Solution

There are 3 Steps involved in it

Step: 1

blur-text-image

Get Instant Access to Expert-Tailored Solutions

See step-by-step solutions with expert insights and AI powered tools for academic success

Step: 2

blur-text-image

Step: 3

blur-text-image

Ace Your Homework with AI

Get the answers you need in no time with our AI-driven, step-by-step assistance

Get Started

Recommended Textbook for

Numerical Analysis

Authors: Richard L. Burden, J. Douglas Faires

9th edition

538733519, 978-1133169338, 1133169333, 978-0538733519

More Books

Students also viewed these Mathematics questions