Answered step by step
Verified Expert Solution
Question
1 Approved Answer
Date A B C D Stock Exchange 09/03/2010 128.69 18.35 21.24 15.53 10376.81 09/07/2010 127.07 18.01 20.63 15.45 10405.22 09/08/2010 126.61 17.83 20.71 15.68 10431.28
| Date | A | B | C | D | Stock Exchange |
| 09/03/2010 | 128.69 | 18.35 | 21.24 | 15.53 | 10376.81 |
| 09/07/2010 | 127.07 | 18.01 | 20.63 | 15.45 | 10405.22 |
| 09/08/2010 | 126.61 | 17.83 | 20.71 | 15.68 | 10431.28 |
| 09/09/2010 | 126.93 | 18.02 | 20.79 | 15.87 | 10445.76 |
| 09/10/2010 | 128.28 | 17.95 | 20.71 | 16.12 | 10537.76 |
| 09/13/2010 | 128.43 | 18.56 | 21.18 | 16.27 | 10597.85 |
| 09/14/2010 | 128.97 | 18.67 | 21.44 | 16.27 | 10553.63 |
| 09/15/2010 | 129.44 | 18.86 | 21.47 | 16.38 | 10560.16 |
| 09/16/2010 | 129.41 | 19.15 | 21.97 | 16.18 | 10630.34 |
| 09/17/2010 | 130.75 | 18.73 | 22.05 | 16.14 | 10521.31 |
| 09/20/2010 | 130.71 | 19.06 | 21.67 | 16.52 | 10801.34 |
| 09/21/2010 | 133.09 | 19.32 | 21.83 | 16.46 | 10824.78 |
Compute the MAD, MSE, and MAPE for each of the models please and thank you
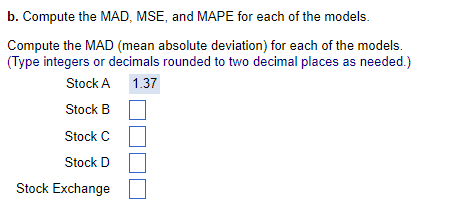
b. Compute the MAD, MSE, and MAPE for each of the models. Compute the MAD (mean absolute deviation) for each of the models. (Type integers or decimals rounded to two decimal places as needed.) Stock A 1.37 Stock B Stock C Stock D Stock ExchangeStep by Step Solution
There are 3 Steps involved in it
Step: 1

Get Instant Access to Expert-Tailored Solutions
See step-by-step solutions with expert insights and AI powered tools for academic success
Step: 2

Step: 3

Ace Your Homework with AI
Get the answers you need in no time with our AI-driven, step-by-step assistance
Get Started


