Answered step by step
Verified Expert Solution
Question
1 Approved Answer
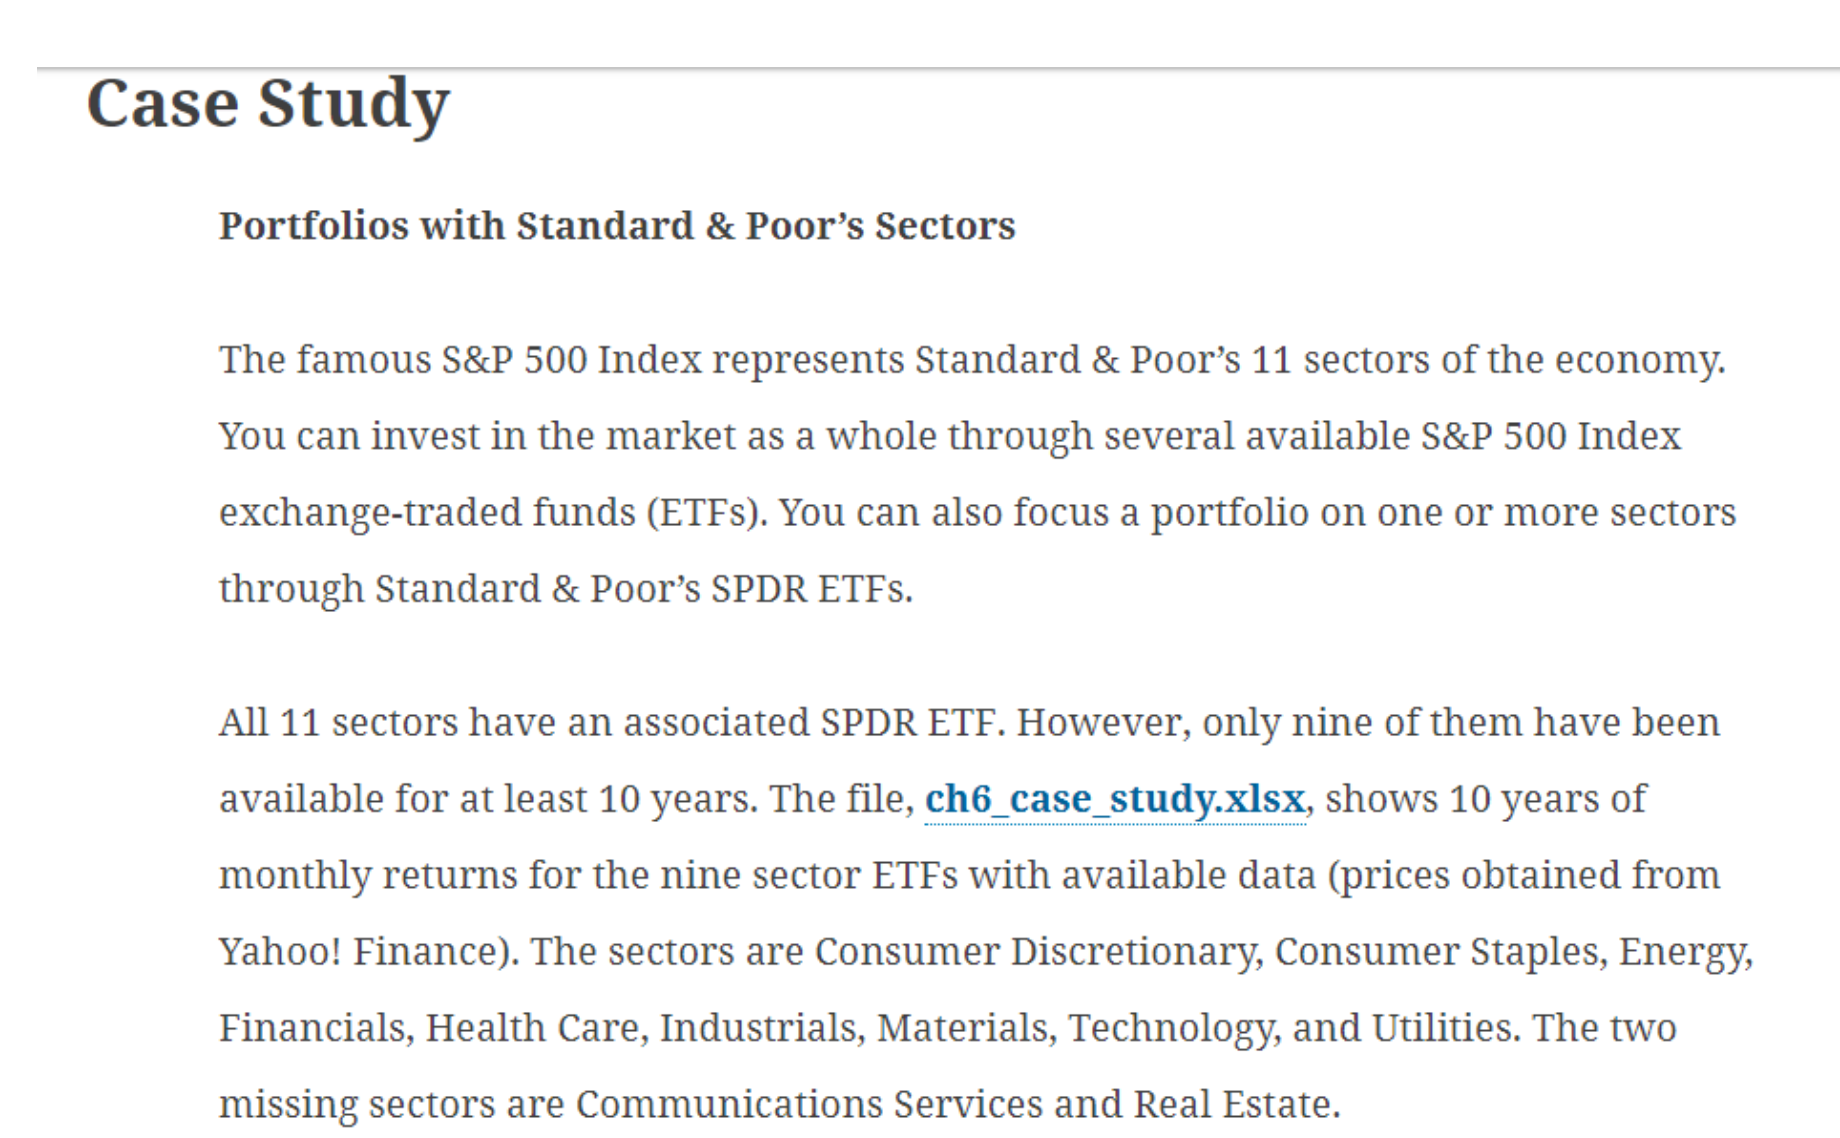
Date Consumer Discretionary Consumer Staples Energy Financials Health Care Industrials Materials Technology Utilities Nov-11 -0.718% 2.771% 1.664% -5.111% 0.954% 1.406% 0.203% -1.499% 1.033% Dec-11 0.723%


| Date | Consumer Discretionary | Consumer Staples | Energy | Financials | Health Care | Industrials | Materials | Technology | Utilities |
| Nov-11 | -0.718% | 2.771% | 1.664% | -5.111% | 0.954% | 1.406% | 0.203% | -1.499% | 1.033% |
| Dec-11 | 0.723% | 1.850% | -2.455% | 1.483% | 2.391% | -0.413% | -2.955% | -0.664% | 2.187% |
| Jan-12 | 6.509% | -0.525% | 2.689% | 8.847% | 3.779% | 8.038% | 11.758% | 6.673% | -2.534% |
| Feb-12 | 4.526% | 3.746% | 5.927% | 4.979% | 1.061% | 2.789% | -0.565% | 7.103% | 0.606% |
| Mar-12 | 4.399% | 2.558% | -4.180% | 7.046% | 3.952% | 0.510% | 0.000% | 4.180% | 0.430% |
| Apr-12 | 1.465% | 0.824% | -0.327% | -2.030% | 0.237% | -0.635% | -0.434% | -0.810% | 2.711% |
| May-12 | -5.503% | -1.170% | -10.682% | -9.203% | -3.626% | -6.323% | -7.772% | -6.338% | 0.561% |
| Jun-12 | 1.578% | 2.931% | 4.306% | 4.497% | 5.145% | 2.884% | 4.347% | 2.864% | 3.151% |
| Jul-12 | -0.197% | 3.179% | 5.449% | 0.618% | 1.544% | 0.868% | -0.740% | 2.240% | 3.468% |
| Aug-12 | 4.616% | -0.477% | 2.699% | 3.411% | 1.172% | 1.536% | 2.325% | 4.204% | -4.140% |
| Sep-12 | 2.722% | 1.043% | 2.656% | 2.836% | 3.296% | 0.468% | 3.226% | 1.115% | 0.110% |
| Oct-12 | -1.195% | -0.531% | -1.590% | 2.412% | 0.272% | 0.537% | -1.580% | -5.971% | 2.474% |
| Nov-12 | 3.169% | 1.837% | -1.223% | -0.881% | 0.525% | 1.754% | 1.860% | 0.901% | -4.282% |
| Dec-12 | -0.189% | -3.163% | 0.507% | 3.997% | -0.895% | 2.074% | 2.289% | -0.961% | -1.133% |
| Jan-13 | 6.348% | 6.830% | 8.855% | 6.705% | 8.179% | 6.528% | 4.861% | 2.493% | 5.936% |
| Feb-13 | 1.596% | 3.309% | 0.440% | 1.208% | 1.258% | 2.221% | -1.358% | 0.782% | 2.324% |
| Mar-13 | 4.064% | 4.411% | 2.085% | 3.525% | 5.754% | 1.928% | 1.793% | 2.160% | 4.462% |
| Apr-13 | 3.346% | 3.451% | -0.869% | 3.037% | 3.449% | -0.312% | 1.360% | 2.167% | 6.879% |
| May-13 | 2.765% | -2.174% | 2.849% | 6.096% | 1.648% | 5.018% | 1.896% | 2.792% | -9.051% |
| Jun-13 | 0.499% | -0.949% | -2.733% | -1.966% | -1.039% | -2.045% | -4.839% | -3.380% | -0.133% |
| Jul-13 | 5.603% | 5.017% | 5.766% | 5.772% | 7.648% | 6.451% | 6.362% | 4.250% | 5.405% |
| Aug-13 | -2.847% | -4.542% | -1.031% | -5.124% | -3.528% | -2.480% | -0.124% | -1.040% | -4.992% |
| Sep-13 | 5.114% | 0.734% | 1.643% | 2.418% | 2.783% | 5.381% | 3.908% | 2.038% | 0.188% |
| Oct-13 | 4.892% | 7.080% | 4.681% | 3.722% | 4.739% | 5.245% | 4.711% | 5.533% | 4.767% |
| Nov-13 | 3.454% | 1.558% | 0.058% | 4.424% | 4.719% | 3.661% | 1.302% | 3.091% | -1.934% |
| Dec-13 | 1.875% | -0.070% | 2.395% | 1.769% | 0.326% | 3.690% | 4.240% | 3.027% | -0.158% |
| Jan-14 | -5.624% | -4.444% | -5.357% | -3.207% | 1.354% | -3.780% | -4.117% | -2.094% | 4.078% |
| Feb-14 | 6.399% | 3.901% | 5.121% | 3.039% | 6.219% | 4.058% | 6.903% | 4.394% | 3.453% |
| Mar-14 | -3.172% | 1.676% | 1.609% | 2.949% | -1.598% | 0.519% | 0.425% | 0.000% | 2.497% |
| Apr-14 | -1.049% | 3.262% | 5.773% | -1.337% | -0.289% | 1.779% | 1.228% | 0.707% | 5.089% |
| May-14 | 2.882% | 1.808% | 1.675% | 1.503% | 2.873% | 1.923% | 2.958% | 3.759% | -1.088% |
| Jun-14 | 1.614% | -0.933% | 5.026% | 2.019% | 1.739% | 0.018% | 1.141% | 1.401% | 3.556% |
| Jul-14 | -0.958% | -2.654% | -3.018% | -1.061% | 0.508% | -3.688% | -1.535% | 2.164% | -6.004% |
| Aug-14 | 4.447% | 4.613% | 2.184% | 4.239% | 4.843% | 4.225% | 3.864% | 3.282% | 4.921% |
| Sep-14 | -3.095% | -0.044% | -8.224% | -0.813% | 0.078% | -1.611% | -1.860% | -0.943% | -2.750% |
| Oct-14 | 2.456% | 4.203% | -3.035% | 3.317% | 5.633% | 4.366% | -1.947% | 2.041% | 9.004% |
| Nov-14 | 5.448% | 5.545% | -8.694% | 2.349% | 3.479% | 3.079% | 1.570% | 4.810% | 1.166% |
| Dec-14 | 0.474% | -1.643% | -0.827% | 1.352% | -1.767% | -0.580% | -1.180% | -2.683% | 2.652% |
| Jan-15 | -2.592% | -0.257% | -3.968% | -6.480% | 1.677% | -3.011% | -1.213% | -3.005% | 3.242% |
| Feb-15 | 8.544% | 4.144% | 4.593% | 5.824% | 4.288% | 5.351% | 7.968% | 7.995% | -6.395% |
| Mar-15 | -0.816% | -2.539% | -1.822% | -0.986% | 0.360% | -2.992% | -5.263% | -3.829% | -1.769% |
| Apr-15 | 0.283% | -0.151% | 7.298% | 0.457% | -0.813% | 0.207% | 3.753% | 3.172% | 0.311% |
| May-15 | 1.315% | 0.868% | -5.189% | 1.948% | 4.504% | 0.324% | 0.377% | 1.855% | 0.633% |
| Jun-15 | 0.236% | -2.439% | -4.120% | -0.894% | -0.734% | -3.136% | -4.386% | -4.542% | -6.831% |
| Jul-15 | 5.224% | 6.348% | -7.077% | 3.857% | 3.312% | 0.794% | -4.608% | 3.313% | 7.067% |
| Aug-15 | -6.532% | -5.963% | -4.252% | -7.061% | -7.964% | -5.404% | -5.637% | -5.519% | -3.478% |
| Sep-15 | -0.960% | -0.254% | -7.873% | -3.286% | -6.043% | -2.730% | -7.934% | -1.815% | 1.955% |
| Oct-15 | 9.447% | 6.382% | 11.980% | 6.786% | 8.106% | 9.367% | 14.058% | 11.005% | 2.017% |
| Nov-15 | -0.235% | -0.922% | -0.015% | 1.993% | -0.322% | 0.866% | 0.994% | 0.710% | -2.126% |
| Dec-15 | -3.243% | 2.165% | -11.320% | -2.972% | 1.294% | -3.160% | -5.051% | -2.570% | 1.074% |
| Jan-16 | -4.789% | 1.275% | -2.624% | -8.283% | -7.328% | -5.124% | -10.040% | -3.229% | 6.030% |
| Feb-16 | 0.445% | 0.315% | -2.800% | -2.901% | -0.361% | 4.261% | 7.815% | -0.655% | 1.937% |
| Mar-16 | 6.260% | 4.203% | 9.385% | 6.686% | 2.340% | 6.427% | 7.201% | 8.274% | 7.171% |
| Apr-16 | 0.539% | -0.926% | 9.843% | 4.060% | 3.335% | 1.763% | 5.475% | -4.547% | -1.685% |
| May-16 | 0.051% | 0.688% | -0.933% | 1.888% | 2.235% | -0.427% | -0.340% | 4.890% | 1.508% |
| Jun-16 | -1.489% | 4.728% | 2.049% | -3.747% | 0.505% | 0.161% | -1.278% | -1.856% | 6.755% |
| Jul-16 | 4.932% | -0.219% | -0.610% | 4.009% | 5.289% | 4.196% | 5.597% | 7.623% | 0.145% |
| Aug-16 | -1.299% | -0.585% | 1.677% | 3.848% | -3.245% | 0.948% | -0.267% | 1.163% | -5.545% |
| Sep-16 | -0.645% | -2.152% | 3.065% | -3.264% | -0.893% | -0.358% | -1.668% | 1.681% | -0.487% |
| Oct-16 | -2.052% | -0.156% | -2.231% | 2.769% | -6.225% | -1.469% | -1.590% | -0.343% | 1.759% |
| Nov-16 | 4.802% | -4.205% | 8.467% | 14.032% | 2.064% | 9.089% | 6.824% | 0.169% | -5.422% |
| Dec-16 | -0.550% | 2.234% | 1.196% | 3.287% | 0.276% | -0.304% | -0.481% | 1.811% | 3.893% |
| Jan-17 | 4.831% | 2.460% | -2.701% | 0.713% | 2.741% | 2.488% | 5.238% | 4.014% | 2.236% |
| Feb-17 | 1.815% | 4.773% | -2.085% | 5.277% | 6.339% | 3.913% | 0.558% | 4.533% | 5.266% |
| Mar-17 | 1.829% | -0.944% | -2.073% | -3.301% | -0.840% | -1.215% | 0.306% | 1.834% | -0.889% |
| Apr-17 | 2.705% | 1.631% | -2.365% | -0.489% | 1.901% | 2.431% | 1.578% | 2.400% | 1.526% |
| May-17 | 1.099% | 2.646% | -3.538% | -1.190% | 0.768% | 1.779% | 0.019% | 3.954% | 4.139% |
| Jun-17 | -1.560% | -3.001% | -0.795% | 6.108% | 4.154% | 0.874% | 1.375% | -3.202% | -3.492% |
| Jul-17 | 2.241% | 1.468% | 3.325% | 2.091% | 1.221% | 0.768% | 2.018% | 4.880% | 3.256% |
| Aug-17 | -1.861% | -1.103% | -5.479% | -1.554% | 1.752% | 0.220% | 0.787% | 2.922% | 3.288% |
| Sep-17 | 0.468% | -1.334% | 8.750% | 4.696% | 0.541% | 3.710% | 3.141% | 0.459% | -3.493% |
| Oct-17 | 2.482% | -1.031% | 0.474% | 3.291% | -0.393% | 1.207% | 4.433% | 6.895% | 4.694% |
| Nov-17 | 5.066% | 5.575% | 1.752% | 3.459% | 2.910% | 4.166% | 0.949% | 1.414% | 2.685% |
| Dec-17 | 2.111% | 1.499% | 4.573% | 1.417% | -0.946% | 1.557% | 1.629% | 0.172% | -6.926% |
| Jan-18 | 9.613% | 2.390% | 4.274% | 7.052% | 6.981% | 5.938% | 4.508% | 7.436% | -2.210% |
| Feb-18 | -3.469% | -7.627% | -10.835% | -2.925% | -4.495% | -3.863% | -5.274% | -0.409% | -3.879% |
| Mar-18 | -2.671% | -1.460% | 1.004% | -4.503% | -3.256% | -3.079% | -4.511% | -4.034% | 2.996% |
| Apr-18 | 2.681% | -3.604% | 10.274% | -0.073% | 1.412% | -2.395% | 0.505% | 0.374% | 2.831% |
| May-18 | 1.987% | -1.566% | 2.994% | -0.984% | 0.182% | 3.074% | 2.052% | 6.783% | -1.106% |
| Jun-18 | 3.347% | 3.766% | -0.105% | -2.171% | 1.274% | -3.775% | -0.189% | -0.615% | 1.902% |
| Jul-18 | 2.070% | 4.764% | 2.240% | 5.570% | 6.949% | 7.816% | 3.337% | 2.449% | 2.506% |
| Aug-18 | 5.105% | 0.392% | -3.475% | 1.360% | 4.329% | 0.234% | -0.770% | 6.599% | 1.288% |
| Sep-18 | 0.231% | 0.279% | 1.746% | -2.647% | 2.554% | 1.686% | -2.261% | -0.357% | -1.534% |
| Oct-18 | -9.832% | 2.723% | -10.718% | -4.291% | -6.415% | -10.437% | -8.751% | -7.693% | 2.892% |
| Nov-18 | 2.477% | 2.272% | -1.563% | 2.626% | 8.083% | 3.807% | 3.802% | -1.962% | 3.539% |
| Dec-18 | -8.316% | -9.740% | -13.251% | -11.680% | -9.763% | -11.208% | -7.489% | -8.772% | -4.803% |
| Jan-19 | 10.298% | 6.102% | 12.252% | 9.579% | 5.284% | 12.115% | 6.289% | 7.402% | 4.356% |
| Feb-19 | 1.315% | 1.779% | 2.305% | 2.236% | 1.081% | 6.368% | 3.187% | 6.910% | 4.109% |
| Mar-19 | 3.303% | 3.257% | 1.333% | -3.054% | 0.109% | -1.716% | 0.817% | 4.431% | 2.035% |
| Apr-19 | 5.823% | 3.415% | 0.769% | 9.541% | -2.352% | 4.571% | 3.961% | 6.709% | 1.677% |
| May-19 | -7.604% | -3.639% | -11.103% | -7.173% | -2.218% | -7.640% | -8.181% | -8.665% | -0.784% |
| Jun-19 | 7.445% | 4.424% | 8.406% | 6.113% | 6.141% | 7.453% | 10.900% | 8.555% | 2.369% |
| Jul-19 | 1.624% | 3.122% | -0.687% | 2.877% | -1.199% | 0.954% | 0.323% | 3.864% | 0.663% |
| Aug-19 | -0.944% | 2.171% | -8.325% | -4.708% | -0.592% | -2.647% | -2.828% | -1.535% | 5.088% |
| Sep-19 | 0.937% | 1.153% | 2.992% | 4.012% | -0.519% | 2.468% | 2.664% | 1.257% | 3.452% |
| Oct-19 | 0.456% | 0.166% | -1.199% | 3.023% | 5.563% | 1.670% | 0.486% | 4.223% | 0.011% |
| Nov-19 | 1.324% | 1.373% | 1.605% | 5.052% | 5.003% | 4.496% | 3.179% | 5.366% | -1.868% |
| Dec-19 | 2.425% | 1.581% | 1.953% | 2.090% | 2.382% | -0.695% | 2.298% | 3.981% | 2.490% |
| Jan-20 | 0.250% | 1.139% | -7.436% | -2.169% | -1.631% | 0.053% | -5.653% | 4.332% | 7.581% |
| Feb-20 | -7.573% | -8.215% | -15.288% | -11.248% | -6.587% | -9.900% | -8.520% | -7.301% | -9.858% |
| Mar-20 | -15.324% | -6.070% | -35.807% | -21.700% | -4.352% | -19.253% | -14.568% | -9.053% | -10.888% |
| Apr-20 | 19.459% | 7.570% | 33.690% | 10.390% | 13.134% | 9.657% | 15.956% | 14.330% | 4.373% |
| May-20 | 6.509% | 1.665% | 2.000% | 2.720% | 3.289% | 5.389% | 6.881% | 7.176% | 4.244% |
| Jun-20 | 2.834% | -0.996% | -2.348% | -1.153% | -2.854% | 1.522% | 1.623% | 6.655% | -5.462% |
| Jul-20 | 7.524% | 7.757% | -3.588% | 4.509% | 5.903% | 4.874% | 7.705% | 5.976% | 8.697% |
| Aug-20 | 9.555% | 4.593% | -1.055% | 4.286% | 2.587% | 8.476% | 4.357% | 11.881% | -2.597% |
| Sep-20 | -2.072% | -2.257% | -15.989% | -3.951% | -2.568% | -1.067% | 1.032% | -5.544% | 0.219% |
| Oct-20 | -2.521% | -2.292% | -2.529% | -0.327% | -3.238% | -1.059% | -0.255% | -4.794% | 5.956% |
| Nov-20 | 9.995% | 7.469% | 27.994% | 16.848% | 7.948% | 16.027% | 12.362% | 11.384% | 0.737% |
| Dec-20 | 2.238% | 0.807% | 3.101% | 5.739% | 3.372% | 0.591% | 1.972% | 5.296% | -0.223% |
| Jan-21 | 0.952% | -4.186% | 5.134% | -1.271% | 1.820% | -3.873% | -1.930% | -0.607% | -0.040% |
| Feb-21 | -0.531% | -1.233% | 22.457% | 11.606% | -2.104% | 6.889% | 4.119% | 1.365% | -6.098% |
| Mar-21 | 4.294% | 7.915% | 1.890% | 5.385% | 3.668% | 8.652% | 7.138% | 1.622% | 9.733% |
| Apr-21 | 6.625% | 2.410% | 1.741% | 6.962% | 4.293% | 3.853% | 5.826% | 5.410% | 4.963% |
| May-21 | -3.398% | 1.768% | 5.710% | 4.771% | 1.871% | 3.130% | 5.082% | -0.931% | -2.338% |
| Jun-21 | 3.304% | -1.186% | 3.179% | -3.422% | 1.901% | -2.588% | -5.673% | 6.691% | -2.962% |
| Jul-21 | 1.203% | 2.865% | -7.379% | -0.069% | 5.332% | 1.257% | 2.521% | 4.078% | 5.144% |
| Aug-21 | 1.785% | 1.049% | -2.004% | 5.148% | 2.316% | 1.113% | 1.892% | 3.559% | 3.896% |
| Sep-21 | -2.287% | -4.733% | 7.624% | -2.266% | -5.850% | -6.382% | -7.593% | -6.005% | -6.799% |
| Oct-21 | 1.924% | 2.392% | 9.920% | 4.420% | -0.283% | 3.512% | 3.065% | 1.947% | 1.393% |
| average | 1.508% | 0.965% | 0.419% | 1.359% | 1.326% | 1.206% | 1.010% | 1.713% | 0.889% |
| standard deviation | 0.04478 | 0.034037899 | 0.07817 | 0.05189 | 0.0379686 | 0.047313 | 0.04915 | 0.045012 | 0.04078 |
Step by Step Solution
There are 3 Steps involved in it
Step: 1

Get Instant Access to Expert-Tailored Solutions
See step-by-step solutions with expert insights and AI powered tools for academic success
Step: 2

Step: 3

Ace Your Homework with AI
Get the answers you need in no time with our AI-driven, step-by-step assistance
Get Started


