Question
Dating Web Site (logistic regression). The dating web site Oollama.com requires its users to create profiles based on a survey in which they rate their
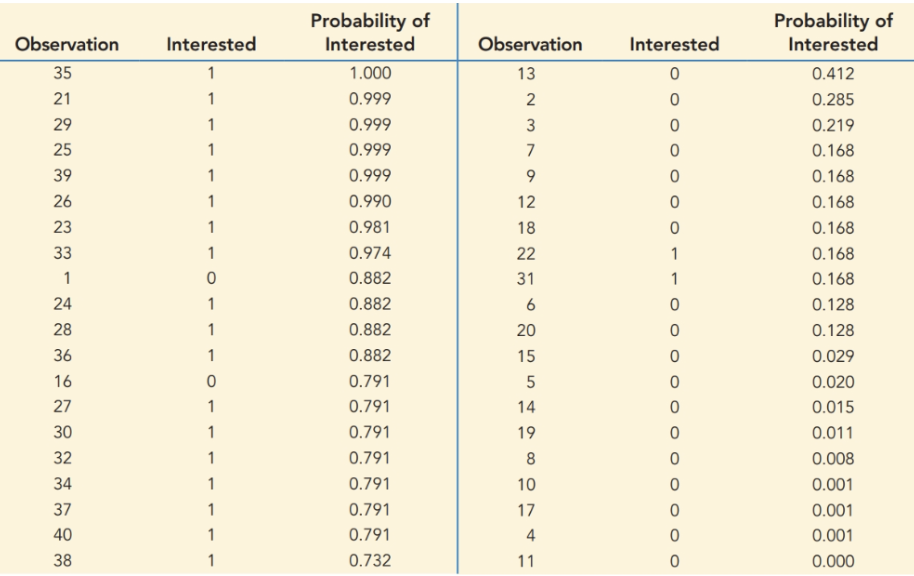
 Dating Web Site (logistic regression). The dating web site Oollama.com requires its users to create profiles based on a survey in which they rate their interest (on a scale from 0 to 3) in five categories: physical fitness, music, spirituality, education, and alcohol consumption. A new Oollama customer, Erin OShaughnessy, has reviewed the profiles of 40 prospective dates and classified whether she is interested in learning more about them. Based on Erins classification of these 40 profiles, Oollama has applied a logistic regression to predict Erins interest in other profiles that she has not yet viewed. The resulting logistic regression model is as follows: Log Odds of Interested = 0.920 + 0.325 X Fitness 3.611 X Music + 5.535 X Education 2.927 X Alcohol For the 40 profiles (observations) on which Erin classified her interest, this logistic regression model generates that following probability of Interested. a. Using a cutoff value of 0.5 to classify a profile observation as Interested or not, construct the confusion matrix for this 40-observation training set. Compute sensitivity, specificity, and precision measures and interpret them within the context of Erins dating prospects. b. Oollama understands that its clients have a limited amount of time for dating and therefore use decile-wise lift charts to evaluate their classification models. For the training data, what is the first decile lift resulting from the logistic regression model? Interpret this value. c. A recently posted profile has values of Fitness 35 , Music15 , Education35 , and Alcohol 15 . Use the estimated logistic regression equation to compute the proba-bility of Erins interest in this profile. d. Now that Oollama has trained a logistic regression model based on Erins initial evaluations of 40 profiles, what should its next steps be in the modeling process?
Step by Step Solution
There are 3 Steps involved in it
Step: 1

Get Instant Access to Expert-Tailored Solutions
See step-by-step solutions with expert insights and AI powered tools for academic success
Step: 2

Step: 3

Ace Your Homework with AI
Get the answers you need in no time with our AI-driven, step-by-step assistance
Get Started


