

Answered step by step
Verified Expert Solution
Question
1 Approved Answer
Davidson Doors is considering an equipment investment that will cost $540,000 Projected net cash flow over the equipments three year the areas fofows Year
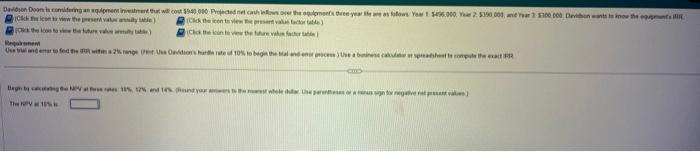
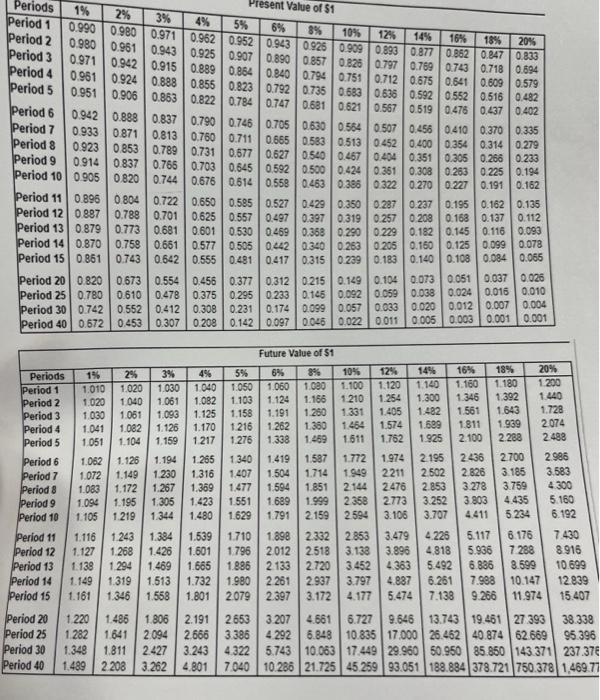
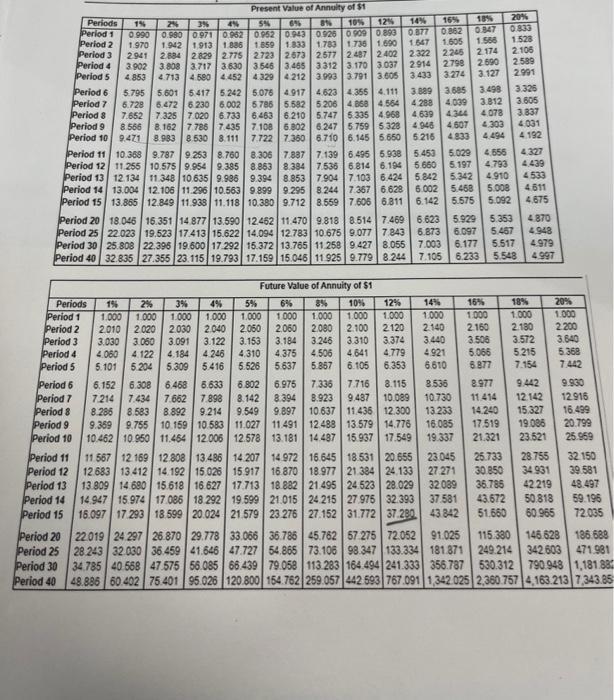
Davidson Doors is considering an equipment investment that will cost $540,000 Projected net cash flow over the equipments three year the areas fofows Year 1 $456,000 Year 2 $300,000, and Year 3 300 000 Deviton wants to know the eggs t Click the icon to view the present valus any ble) view the present value factor table) future value factor Use bal and emer to find the within a 2% range (nt Use Davidson's handle rate of 10% to begin the stal and on peces) Use a businese calculate set the exact Begin by cacg the Vattes 1% 12% and 14% and your as to the mast whole da se parentheses o anus sign for negative t The NPV 10% Periods Period 1 Period 2 Period 3 Period 4 Period 5 Period 6 0.942 Period 7 1% Present Value of $1 0.933 0.871 Period 8 0.923 0.853 0.789 Period 9 0.914 0.837 0.766 Period 10 0.905 0.820 Period 11 0.896 0.804 Period 12 0.887 Period 13 0.879 Period 14 0.870 0.758 0.722 0.650 0.788 0.701 0.625 0.773 0.681 0.601 0.577 0.661 Period 15 0.861 0.743 0.642 0.555 Period 20 0.820 0.673 0.554 0.456 Period 25 0.780 0.610 0.478 0.375 Period 30 0.742 0.552 0.412 0.308 0.231 Period 40 0.672 0.453 0.307 0.208 0.142 18% 20% 2% 3% 4% 0.990 5% 0.980 0.971 0.962 0.952 0.943 0.926 0.909 0.893 0.877 0.862 0.847 0.833 6% 8% 10% 12% 14% 16% 0.980 0.961 0.943 0.925 0.907 0.971 0.942 0.915 0.889 0.864 0.840 0.794 0.751 0.712 0.675 0.641 0.609 0.579 0.890 0.857 0.828 0.797 0.769 0.743 0.718 0.694 0.961 0.924 0.888 0.855 0.823 0.792 0.735 0.683 0.636 0.592 0.552 0.516 0.482 0.951 0.906 0.863 0.822 0.784 0.747 0.681 0.621 0.567 0.519 0.476 0.437 0.402 0.888 0.837 0.790 0.746 0.705 0.630 0.564 0.507 0.456 0.410 0.370 0.335 0.813 0.760 0.711 0.665 0.583 0.513 0.452 0.400 0.354 0.314 0.279 0.731 0.577 0.627 0.540 0.467 0.404 0.351 0.305 0.266 0.233 0.703 0.645 0.592 0.500 0.424 0.361 0.308 0.263 0.225 0.194 0.744 0.676 0.614 0.558 0.463 0.386 0.322 0.270 0.227 0.191 0.162 0.585 0.527 0.429 0.350 0.287 0.237 0.195 0.162 0.135 0.557 0.497 0.397 0.319 0.257 0.208 0.168 0.137 0.112 0.530 0.469 0.368 0.290 0.229 0.182 0.145 0.116 0.093 0.505 0.442 0.340 0.263 0.205 0.160 0.125 0.099 0.078 0.481 0.417 0.315 0.239 0.183 0.140 0.108 0.084 0.065 0.377 0.312 0.215 0.149 0.104 0.073 0.051 0.037 0.026 0.295 0.233 0.145 0.092 0.059 0.038 0.024 0.016 0.010 0.004 0.174 0.099 0.057 0.033 0.020 0.012 0.007 0.005 0.003 0.001 0.001 0.097 0.046 0.022 0.011 Future Value of $1 Periods 1% 2% 3% 4% 5% 6% 8% 10% 12% 14% Period 1 1.010 1.020 1.030 1.040 1.050 1.060 1.080 1.100 1.120 16% 1.160 1.140 18% 20% 1.180 1.200 Period 2 1.020 1.040 1.061 1.082 1.103 1.124 1.166 1.210 1.254 1.300 1.346 1.392 1.440 Period 3 1.030 1.061 1.093 1.125 1.158 1.191 1.260 1.331 1.405 1.482 1.561 1.643 1.728 Period 4 1.041 1.082 1.126 1.170 1.216 1.262 1.360 1.464 1.574 1.689 1.811 1.939 2.074 Period 5 1.051 1.104 1.159 1.217 1.276 1.338 1.469 1.611 1.762 1.925 2.100 2.288 2.488 Period 6 Period 7 Period 8 Period 9 Period 10 1.062 1.126 1.072 1.149 1.230 1.083 1.172 1.267 1.194 1.265 1.340 1.316 1.407 1.369 1.477 1.344 1.480 1.384 1.539 1.710 Period 12 1.127 1.268 1.426 1.601 1.796 Period 13 1.138 1.294 1.469 1.665 Period 14 1.149 1.319 1.513 1.732 1.980 2.261 Period 15 1.161 1.346 1.558 1.801 1.419 1.587 1.772 1.974 2.195 2.436 1.504 1.714 1.949 2211 2.502 2.826 1.594 1.851 2.144 2.476 2.853 3.278 3.759 1.094 1.195 1.305 1.423 1.551 1.689 1.999 2.358 2.773 1.105 1.219 1.629 1.791 2.159 2.594 Period 11 1.116 1.243 2.700 2.986 3.185 3.583 4.300 3.252 3.803 4.435 5.160 3.106 3.707 4.411 5.234 6.192 1.898 2.332 2.853 3.479 4.226 5.117 6.176 7.430 2012 2.518 3.138 3.896 4.818 5.936 7.288 8.916 1.886 2.133 2.079 2.397 Period 20 1.220 1.486 1.806 2.191 Period 25 1.282 1.641 2.094 2.666 Period 30 1.348 1.811 2.427 3.243 Period 40 1.489 2.208 3.262 4.801 5.492 6.886 8.599 3.797 4.887 6.261 7.988 3.172 4.177 5.474 7.138 9.266 11.974 15.407 2653 3.207 4.661 6.727 9.646 13.743 19.461 27.393 38.338 3.386 4.292 6.848 10.835 17.000 26.462 40.874 62.669 95.396 4.322 5.743 10.063 17.449 29.960 50.950 85.850 143.371 237.376 7.040 10.286 21.725 45.259 93.051 188.884 378.721 750.378 1,469.77 2.720 3.452 4.363 10.699 2.937 10.147 12.839 Present Value of Annuity of $1 Periods 1% Period 1 0.990 Period 2 1.970 Period 3 2.941 Period 4 3.902 Period 5 2% 3% 4% 4.853 6% 8% 10% 0.980 0.971 0.962 0.952 0.943 0.926 0909 0.893 1.942 1913 1.886 1.859 1.833 1.783 1.736 1.690 2.884 2.829 2.775 2.723 2.673 2.577 2.487 2.402 3.808 3.717 3.630 3.546 3.465 3.312 3.170 3.037 4.713 4.580 4.452 4.329 4.212 3.993 3.791 3.605 Period 6 5.601 5.417 5.242 5.076 4.917 4.623 4.355 4.111 Period 7 6.728 6.472 6.230 6.002 5.786 5.582 5.206 4.868 4.564 Period 8 7.652 7.325 7.020 6.733 6.463 6.210 5.747 5.335 4.968 Period 9 8.566 8.162 7.786 7.435 7.108 6.802 6.247 5.759 5.328 Period 10 9.471 8.983 8.530 8.111 7.722 7.360 6.710 6.145 5.650 Period 11 10.368 9.787 9.253 8.760 8.306 7.887 7.139 6.495 5.938 Period 12 11.255 10.575 9.954 9.385 8.863 8.384 7.536 6.814 6.194 Period 13 12 134 11.348 10.635 9.986 9.394 8.853 7.904 7.103 6.424 Period 14 13.004 12.106 11.296 10.563 9.899 9.295 8.244 7.367 6.628 Period 15 13.865 12.849 11.938 11.118 10.380 9.712 8.559 7.606 6.811 6.142 5% 12% 14% 16% 18% 20% 0.877 0.862 0.847 0.833 1.647 1.605 1.566 1.528 2.322 2.245 2.174 2.106 2.914 2798 2.690 2.589 3.433 3.127 3.274 2.991 3.889 3.685 5.795 3.498 3.326 4.288 4.039 3.812 3.605 4.639 4.344 4.078 3.837 4.946 4.607 4.303 4.031 5.216 4.833 4.494 4.192 5.453 5.029 4.656 4.327 5.660 5.197 4.793 4.439 5.842 6.002 5.342 4.910 4.533 5.468 5.008 4.611 5.092 4.675 5.575 6.097 5.467 4.948 Period 20 18.046 16.351 14.877 13.590 12.462 11.470 9.818 8.514 7.469 6.623 5.929 5.353 4.870 Period 25 22.023 19.523 17.413 15.622 14.094 12.783 10.675 9.077 7.843 6.873 Period 30 25.808 22.396 19.600 17.292 15.372 13.765 11.258 9.427 8.055 7.003 6.177 5.517 4.979 Period 40 32.835 27.355 23.115 19.793 17.159 15.046 11.925 9.779 7.105 6.233 5.548 4.997 8.244 Future Value of Annuity of $1 2% 3.060 3.091 Period 10 Periods 1% Period 1 1.000 1.000 Period 2 2010 2.020 Period 3 3.030 Period 4 4.060 4.122 4.184 Period 5 5.101 5.204 5.309 5.416 Period 6 6.152 6.308 6.468 6.633 6.802 Period 7 7.214 7.434 7.662 7.898 8.142 8.394 8.285 8.583 Period 8 8.892 9.214 9.549 9.897 Period 9 9.359 9.755 10.159 10.583 11.027 11.491 10.462 10.950 11.454 12.006 12.578 13.181 3% 4% 5% 6% 8% 10% 1.000 1.000 1.000 1.000 1.000 12% 1.000 1.000 1.000 14% 16% 18% 20% 1.000 1.000 1.000 2030 2.040 2.050 2.060 2.080 2.100 2.120 2.140 2.160 2.180 2.200 3.122 3.153 3.184 3.246 3.310 3.374 3.440 3.506 3.572 3.640 4.246 4.310 4.375 4.506 5.526 4.641 4.779 4.921 5.066 5.215 5.368 6.105 6.975 5.637 5.867 7.336 7.716 8.115 8.536 8.923 9.487 10.089 10.730 11.414 10.637 11.436 12.300 13.233 14.240 12.488 13.579 14.776 14.487 15.937 17.549 6.353 6.610 6.877 7.154 7.442 8.977 9.442 9.930 12.142 12.916 15.327 16.499 16.085 17.519 19.086 20.799 19.337 21.321 23.521 25.969 Period 11 11.567 12 169 12.808 13.486 14.207 14.972 16.645 18.531 20.655 Period 12 12.683 13.412 14.192 15.026 15.917 16.870 18.977 21.384 24.133 Period 13 13.809 14.680 15.618 16.627 17.713 18.882 21.495 24.523 28.029 Period 14 14.947 15.974 17.086 18.292 19.599 21.015 24.215 27.975 32.393 Period 15 16.097 17.293 18.599 20.024 21.579 23.276 27.152 31.772 37.280 Period 20 22.019 24.297 26.870 29.778 33.066 36.786 45.762 57.275 72.052 Period 25 28.243 32.030 36.459 41.646 47.727 54.865 73.106 98.347 133.334 Period 30 34.785 40 568 47.575 56.085 66.439 79.058 113.283 164.494 241.333 356.787 530.312 790.948 1,181.882 Period 40 48.886 60.402 75.401 95.026 120.800 154.762 259.057 442 593 767.091 1,342.025 2,360.757 4,163.213 7,343.85 91.025 181.871 342.603 471.981 23.045 25.733 28.755 32.150 27.271 30.850 34.931 39.581 32.089 36.786 42.219 48.497 37.581 43.672 43 842 51.660 50.818 59.196 60.965 72.035 115.380 146 628 186.688 249.214
Step by Step Solution
There are 3 Steps involved in it
Step: 1
It appears that you have provided a table of present values and future values of 1 at different interest rates and periods The table shows the value o...
Get Instant Access to Expert-Tailored Solutions
See step-by-step solutions with expert insights and AI powered tools for academic success
Step: 2

Step: 3
Ace Your Homework with AI
Get the answers you need in no time with our AI-driven, step-by-step assistance
Get Started
Managerial Accounting
Authors: Karen Wilken Braun, Wendy Tietz, Walter Harrison, Rhonda Pyp
1st Canadian Edition
978-0132490252, 132490250, 978-0176223311