Dear Expert,
I am trying to enhance the answer for the following Linear Demand Model question but facing difficulties in providing real world examples that are supported with facts and figures. Would you mind to have a look and help me out with some ideas? Is there any literatures that I can use as supporting documents?
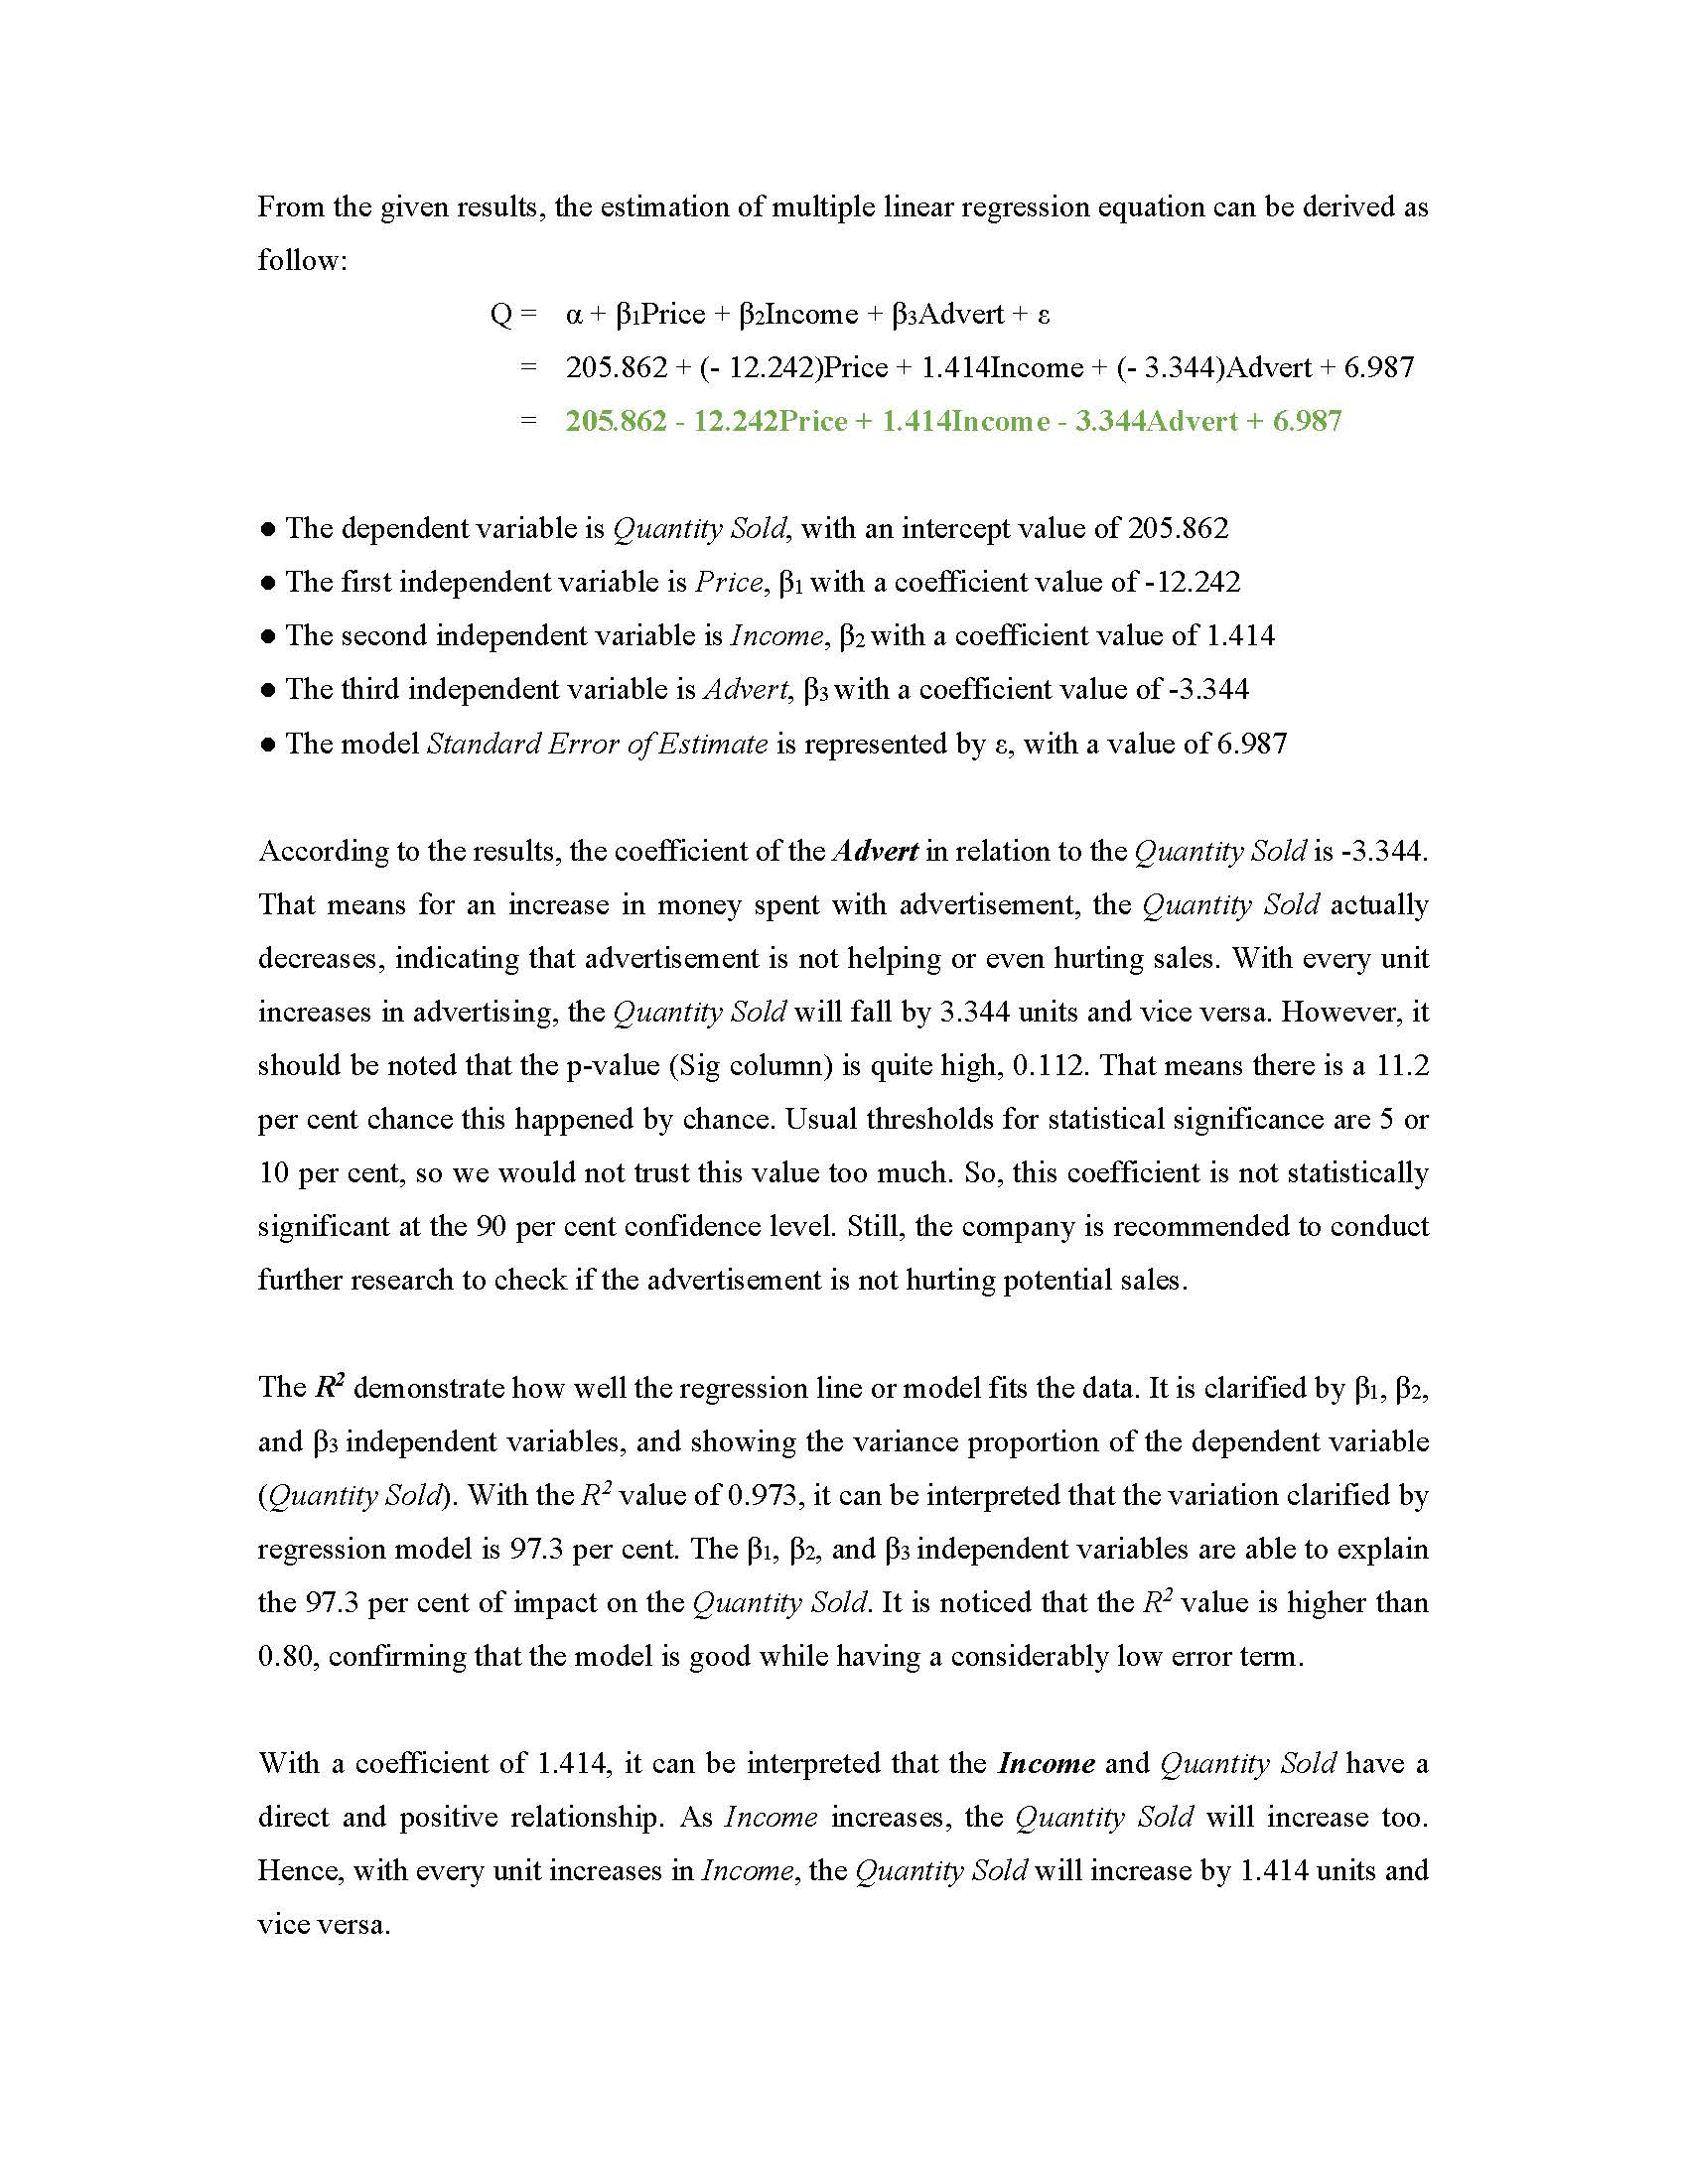
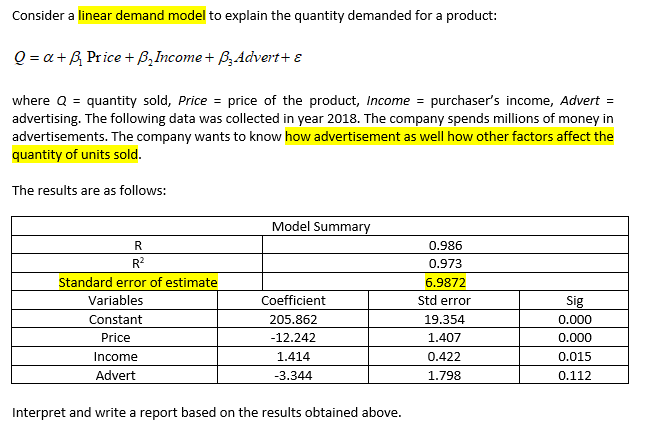
From the given results, the estimation of multiple linear regression equation can be derived as follow: Q = o. + BiPrice + BzIncome + BsAdvert + a = 205.862 + (- 12.242)Price + 1.414Income + (- 3.344)Advert + 6.987 = 205.862 12.242Price + 1.414Income 3.344Advert + 6.987 0 The dependent variable is Quantity Sold, with an intercept value of 205.862 0 The rst independent variable is Price, [31 with a coefficient value of - 12.242 0 The second independent variable is Income, [32 with a coefficient value of 1.414 0 The third independent variable is Advert, [33 with a coefcient value of -3.344 0 The model Standard Error ofEstimate is represented by 8, with a value of 6.987 According to the results, the coefficient of the Advert in relation to the Quantity Sold is -3.344. That means for an increase in money spent with advertisement, the Quantity Sold actually decreases, indicating that advertisement is not helping or even hurting sales. With every unit increases in advertising, the Quantity Sold will fall by 3.344 units and vice versa. However, it should be noted that the p-value (Sig column) is quite high, 0.112. That means there is a 11.2 per cent chance this happened by chance. Usual thresholds for statistical significance are 5 or 10 per cent, so we would not trust this value too much. So, this coefcient is not statistically significant at the 90 per cent confidence level. Still, the company is recommended to conduct further research to check if the advertisement is not hurting potential sales. The R2 demonstrate how well the regression line or model fits the data. It is clarified by [31, B2, and [53 independent variables, and showing the variance proportion of the dependent variable (Quantity Sold). With the R2 value of 0.973, it can be interpreted that the variation claried by regression model is 97.3 per cent. The [31, [32, and [33 independent variables are able to explain the 97.3 per cent of impact on the Quantity Sold. It is noticed that the R2 value is higher than 0.80, confirming that the model is good while having a considerably low error term. With a coefficient of 1.414, it can be interpreted that the Income and Quantity Sold have a direct and positive relationship. As Income increases, the Quantity Sold will increase too. Hence, with every unit increases in Income, the Quantity Sold will increase by 1.414 units and vice versa. Consider a linear demand model to explain the quantity demanded for a product: Q = at + 1.31 PI ice + lfrrcame + a Advert+ E where Q = quantityr sold, Price = price of the product, income = purchaser's income, Advert = advertising. The following data was collected in year 2018. The company spends millions of money in advertisements. The oompany wants to know how advertisement as well how other factors affect the quantity of units sold. The results are as follows: Model Summary (1.935 (1923 Standard error of estimate 5.9822 variables Std error constant eds 8152 19.354 Price 12.242 1.40? Income 1.414 [L422 Advert 1392 Interpret and write a report based on the res ulis obtained above