Question
#Dear Student, # #Welcome to the dataset for the homework exercise. # #Instructions for this dataset: # You have only been supplied vectors. You will

#Dear Student,
#
#Welcome to the dataset for the homework exercise.
#
#Instructions for this dataset:
# You have only been supplied vectors. You will need
# to create the matrices yourself.
# Matrices:
# - FreeThrows
# - FreeThrowAttempts
#Comments:
#Seasons are labeled based on the first year in the season
#E.g. the 2012-2013 season is preseneted as simply 2012
#Notes and Corrections to the data:
#Kevin Durant: 2006 - College Data Used #Kevin Durant: 2005 - Proxied With 2006 Data #Derrick Rose: 2012 - Did Not Play #Derrick Rose: 2007 - College Data Used #Derrick Rose: 2006 - Proxied With 2007 Data #Derrick Rose: 2005 - Proxied With 2007 Data #Seasons Seasons
#Matrix
# #
# #Free Throw Attempts KobeBryant_FTA
#Matrix
# #
#
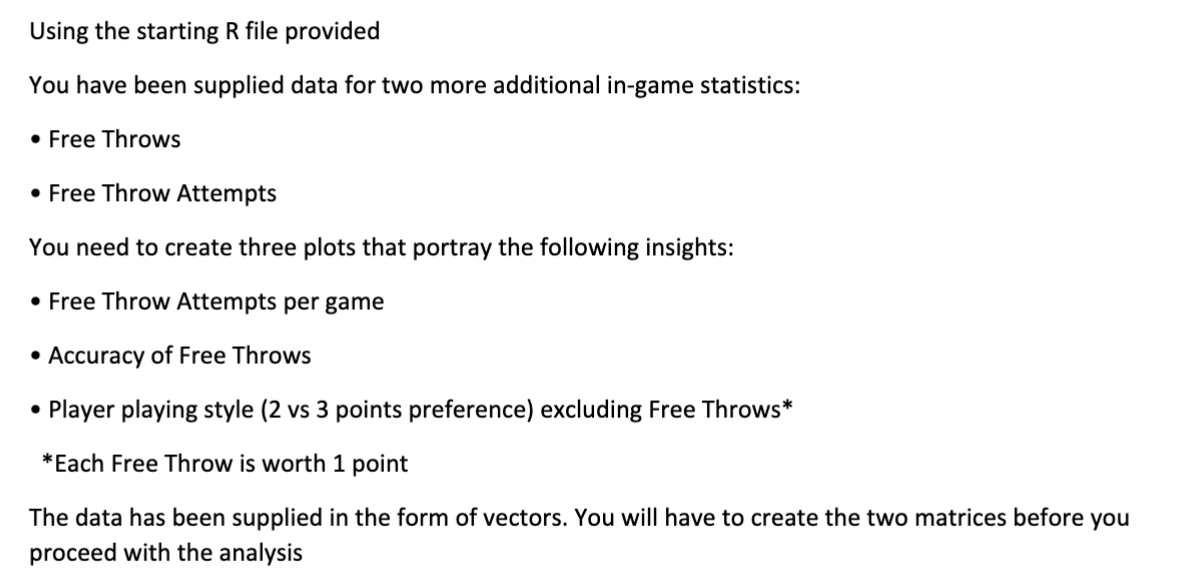
Using the starting R file provided You have been supplied data for two more additional in-game statistics: - Free Throws - Free Throw Attempts You need to create three plots that portray the following insights: - Free Throw Attempts per game - Accuracy of Free Throws - Player playing style ( 2 vs 3 points preference) excluding Free Throws* *Each Free Throw is worth 1 point The data has been supplied in the form of vectors. You will have to create the two matrices before you proceed with the analysisStep by Step Solution
There are 3 Steps involved in it
Step: 1

Get Instant Access to Expert-Tailored Solutions
See step-by-step solutions with expert insights and AI powered tools for academic success
Step: 2

Step: 3

Ace Your Homework with AI
Get the answers you need in no time with our AI-driven, step-by-step assistance
Get Started


