Answered step by step
Verified Expert Solution
Question
1 Approved Answer
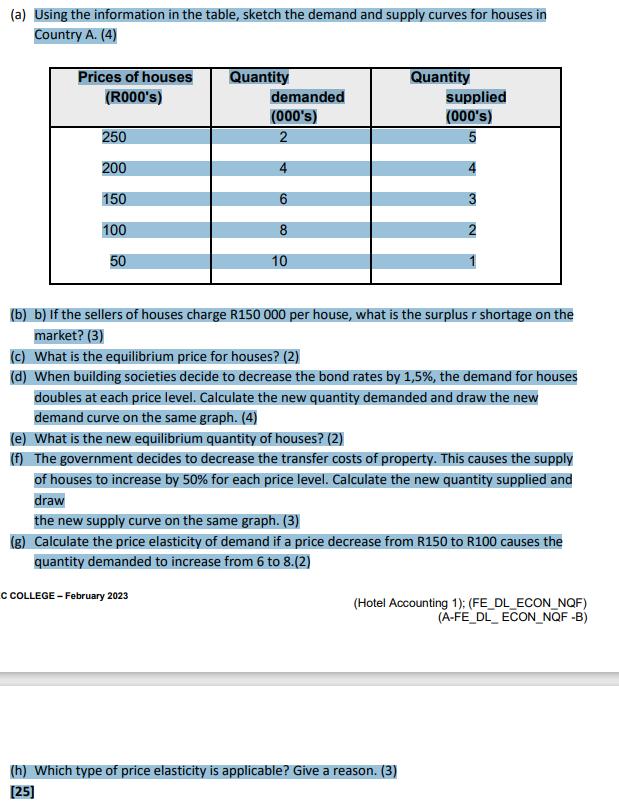
(a) Using the information in the table, sketch the demand and supply curves for houses in Country A. (4) Prices of houses (R000's) 250

(a) Using the information in the table, sketch the demand and supply curves for houses in Country A. (4) Prices of houses (R000's) 250 200 150 100 50 Quantity demanded (000's) 2 4 6 C COLLEGE - February 2023 8 10 Quantity (b) b) If the sellers of houses charge R150 000 per house, what is the surplus r shortage on the market? (3) (c) What is the equilibrium price for houses? (2) (d) When building societies decide to decrease the bond rates by 1,5%, the demand for houses supplied (000's) 5 doubles at each price level. Calculate the new quantity demanded and draw the new demand curve on the same graph. (4) (e) What is the new equilibrium quantity of houses? (2) (f) The government decides to decrease the transfer costs of property. This causes the supply of houses to increase by 50% for each price level. Calculate the new quantity supplied and draw the new supply curve on the same graph. (3) (g) Calculate the price elasticity of demand if a price decrease from R150 to R100 causes the quantity demanded to increase from 6 to 8.(2) (h) Which type of price elasticity is applicable? Give a reason. (3) [25] (Hotel Accounting 1): (FE_DL_ECON_NQF) (A-FE_DL ECON_NQF-B)
Step by Step Solution
★★★★★
3.43 Rating (159 Votes )
There are 3 Steps involved in it
Step: 1
b If sellers charge R150 000 per house we can determine the surplus or shortage by comparing the quantity demanded and quantity supplied ...
Get Instant Access to Expert-Tailored Solutions
See step-by-step solutions with expert insights and AI powered tools for academic success
Step: 2

Step: 3

Ace Your Homework with AI
Get the answers you need in no time with our AI-driven, step-by-step assistance
Get Started


