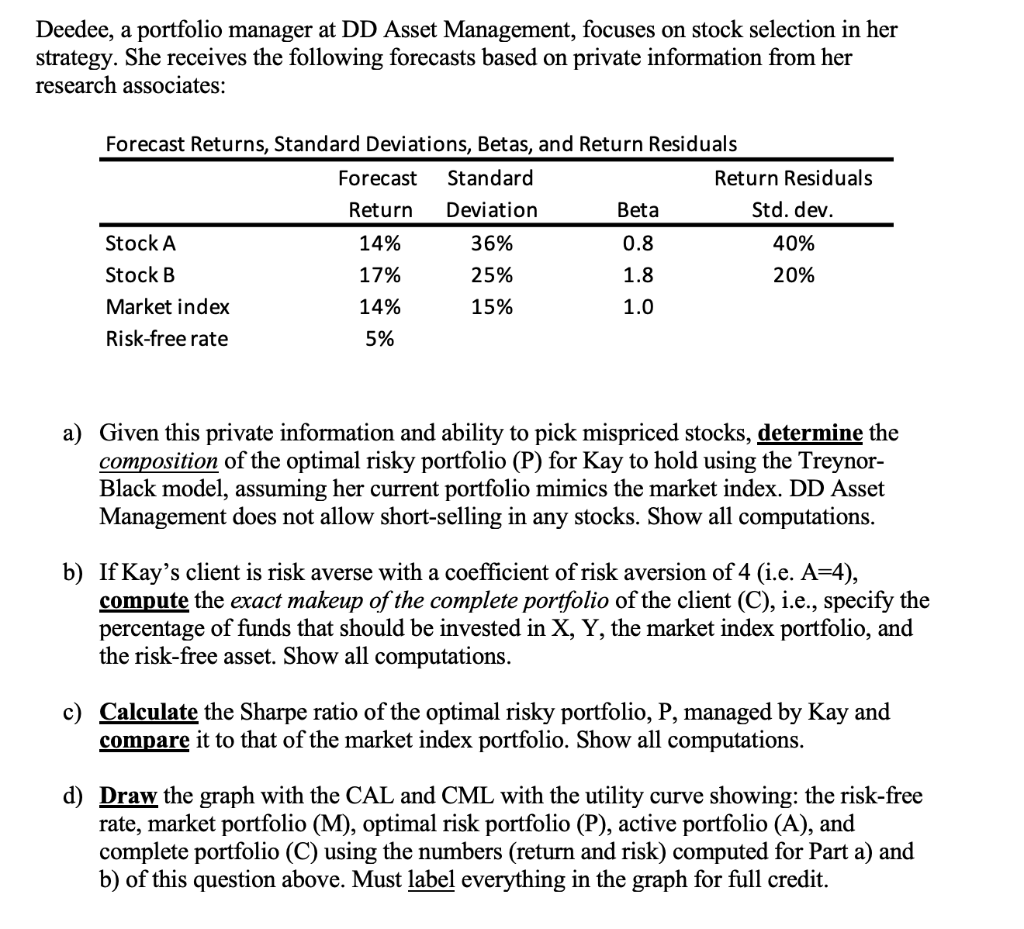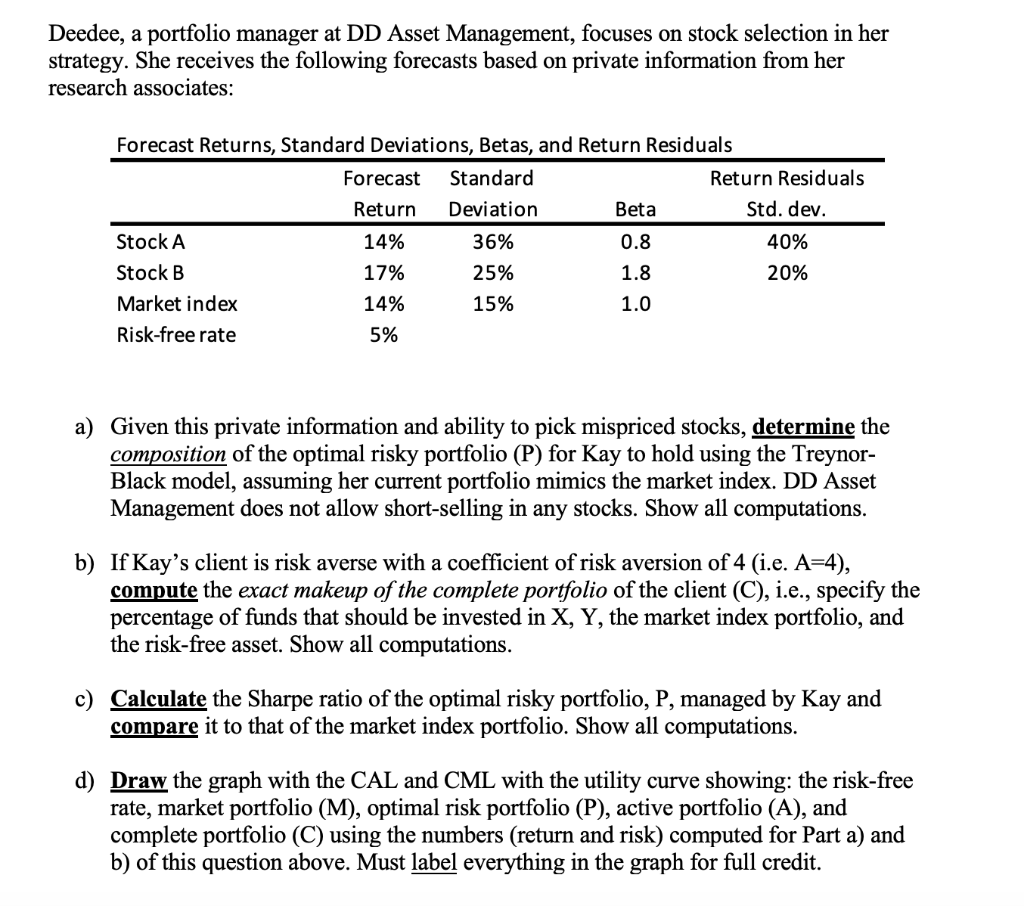

Deedee, a portfolio manager at DD Asset Management, focuses on stock selection in her strategy. She receives the following forecasts based on private information from her research associates: Forecast Returns, Standard Deviations, Betas, and Return Residuals Forecast Standard Return Residuals Return Deviation Beta Std. dev. Stock A 14% 36% 0.8 40% Stock B 17% 25% 1.8 20% Market index 14% 15% 1.0 Risk-free rate 5% a) Given this private information and ability to pick mispriced stocks, determine the composition of the optimal risky portfolio (P) for Kay to hold using the Treynor- Black model, assuming her current portfolio mimics the market index. DD Asset Management does not allow short-selling in any stocks. Show all computations. b) If Kay's client is risk averse with a coefficient of risk aversion of 4 (i.e. A=4), compute the exact makeup of the complete portfolio of the client (C), i.e., specify the percentage of funds that should be invested in X, Y, the market index portfolio, and the risk-free asset. Show all computations. c) Calculate the Sharpe ratio of the optimal risky portfolio, P, managed by Kay and compare it to that of the market index portfolio. Show all computations. Draw the graph with the CAL and CML with the utility curve showing: the risk-free rate, market portfolio (M), optimal risk portfolio (P), active portfolio (A), and complete portfolio (C) using the numbers (return and risk) computed for Part a) and b) of this question above. Must label everything in the graph for full credit. Deedee, a portfolio manager at DD Asset Management, focuses on stock selection in her strategy. She receives the following forecasts based on private information from her research associates: Forecast Returns, Standard Deviations, Betas, and Return Residuals Forecast Standard Return Residuals Return Deviation Beta Std. dev. Stock A 14% 36% 0.8 40% Stock B 17% 25% 1.8 20% Market index 14% 15% 1.0 Risk-free rate 5% a) Given this private information and ability to pick mispriced stocks, determine the composition of the optimal risky portfolio (P) for Kay to hold using the Treynor- Black model, assuming her current portfolio mimics the market index. DD Asset Management does not allow short-selling in any stocks. Show all computations. b) If Kay's client is risk averse with a coefficient of risk aversion of 4 (i.e. A=4), compute the exact makeup of the complete portfolio of the client (C), i.e., specify the percentage of funds that should be invested in X, Y, the market index portfolio, and the risk-free asset. Show all computations. c) Calculate the Sharpe ratio of the optimal risky portfolio, P, managed by Kay and compare it to that of the market index portfolio. Show all computations. d) Draw the graph with the CAL and CML with the utility curve showing: the risk-free rate, market portfolio (M), optimal risk portfolio (P), active portfolio (A), and complete portfolio (C) using the numbers (return and risk) computed for Part a) and b) of this question above. Must label everything in the graph for full credit. Deedee, a portfolio manager at DD Asset Management, focuses on stock selection in her strategy. She receives the following forecasts based on private information from her research associates: Forecast Returns, Standard Deviations, Betas, and Return Residuals Forecast Standard Return Residuals Return Deviation Beta Std. dev. Stock A 14% 36% 0.8 40% Stock B 17% 25% 1.8 20% Market index 14% 15% 1.0 Risk-free rate 5% a) Given this private information and ability to pick mispriced stocks, determine the composition of the optimal risky portfolio (P) for Kay to hold using the Treynor- Black model, assuming her current portfolio mimics the market index. DD Asset Management does not allow short-selling in any stocks. Show all computations. b) If Kay's client is risk averse with a coefficient of risk aversion of 4 (i.e. A=4), compute the exact makeup of the complete portfolio of the client (C), i.e., specify the percentage of funds that should be invested in X, Y, the market index portfolio, and the risk-free asset. Show all computations. c) Calculate the Sharpe ratio of the optimal risky portfolio, P, managed by Kay and compare it to that of the market index portfolio. Show all computations. Draw the graph with the CAL and CML with the utility curve showing: the risk-free rate, market portfolio (M), optimal risk portfolio (P), active portfolio (A), and complete portfolio (C) using the numbers (return and risk) computed for Part a) and b) of this question above. Must label everything in the graph for full credit. Deedee, a portfolio manager at DD Asset Management, focuses on stock selection in her strategy. She receives the following forecasts based on private information from her research associates: Forecast Returns, Standard Deviations, Betas, and Return Residuals Forecast Standard Return Residuals Return Deviation Beta Std. dev. Stock A 14% 36% 0.8 40% Stock B 17% 25% 1.8 20% Market index 14% 15% 1.0 Risk-free rate 5% a) Given this private information and ability to pick mispriced stocks, determine the composition of the optimal risky portfolio (P) for Kay to hold using the Treynor- Black model, assuming her current portfolio mimics the market index. DD Asset Management does not allow short-selling in any stocks. Show all computations. b) If Kay's client is risk averse with a coefficient of risk aversion of 4 (i.e. A=4), compute the exact makeup of the complete portfolio of the client (C), i.e., specify the percentage of funds that should be invested in X, Y, the market index portfolio, and the risk-free asset. Show all computations. c) Calculate the Sharpe ratio of the optimal risky portfolio, P, managed by Kay and compare it to that of the market index portfolio. Show all computations. d) Draw the graph with the CAL and CML with the utility curve showing: the risk-free rate, market portfolio (M), optimal risk portfolio (P), active portfolio (A), and complete portfolio (C) using the numbers (return and risk) computed for Part a) and b) of this question above. Must label everything in the graph for full credit


