Define the null and alternative hypothesis in mathematical terms and in words. Report the level of significance. Include the test statistic and the P-value. See
Define the null and alternative hypothesis in mathematical terms and in words.
Report the level of significance.
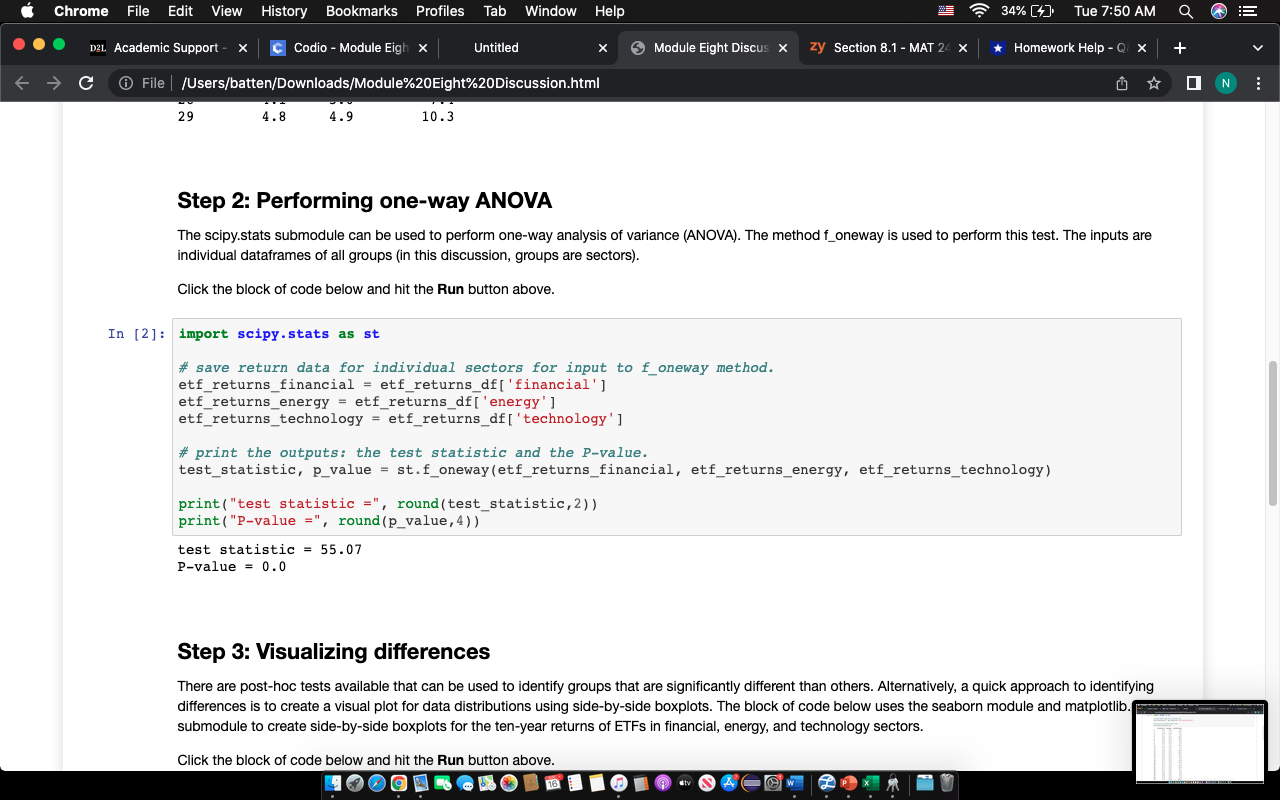
Include the test statistic and the P-value. See Step 2 in the Python script.
Provide your conclusion and interpretation of the test. Should the null hypothesis be rejected? Why or why not?
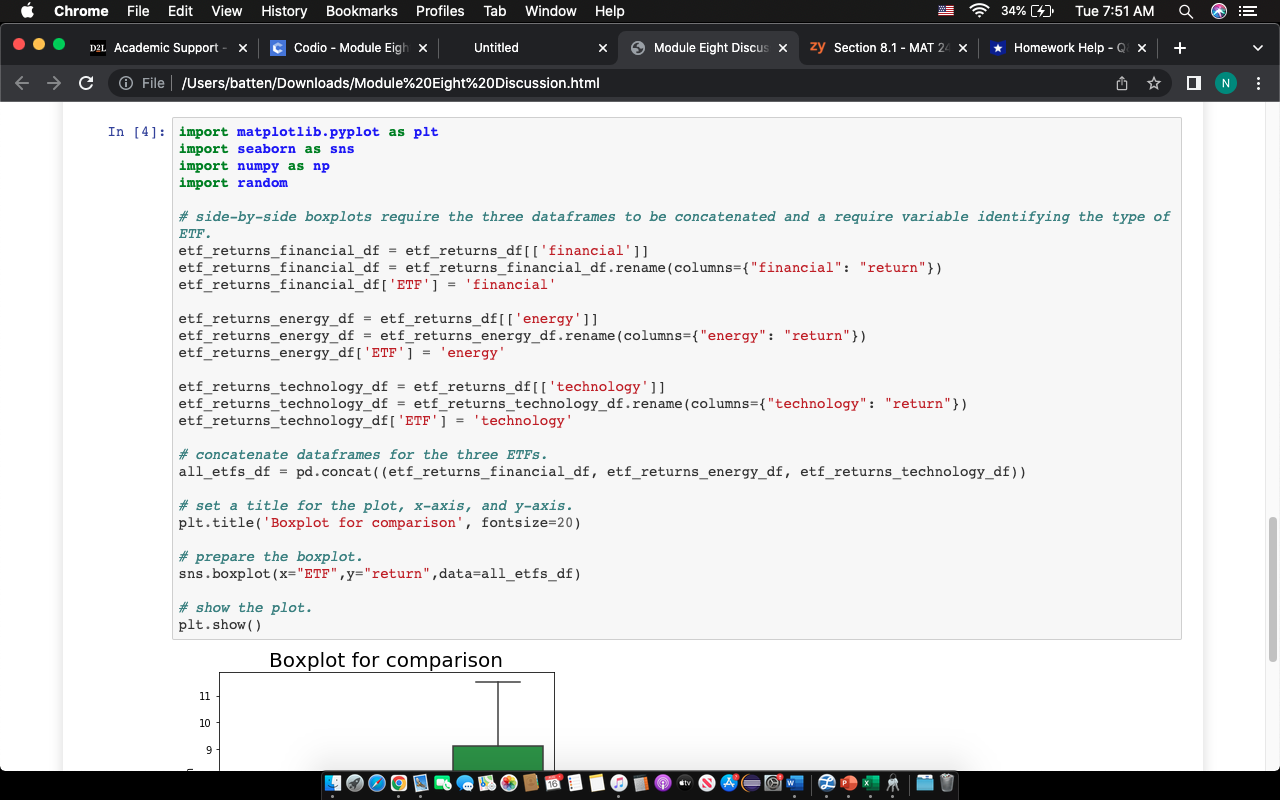
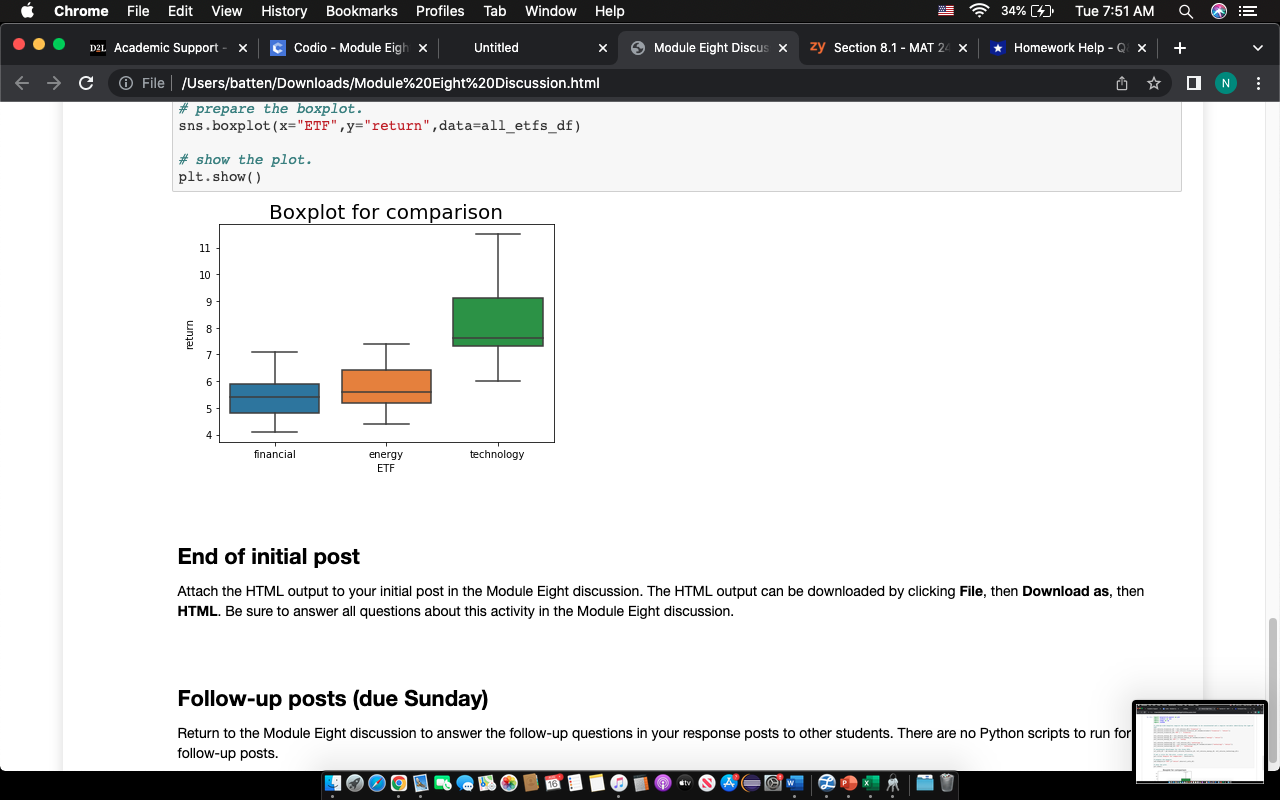
Does a side-by-side boxplot of the 10-year returns of ETFs from the three sectors confirm your conclusion of the hypothesis test? Why or why not? See Step 3 in the Python script.
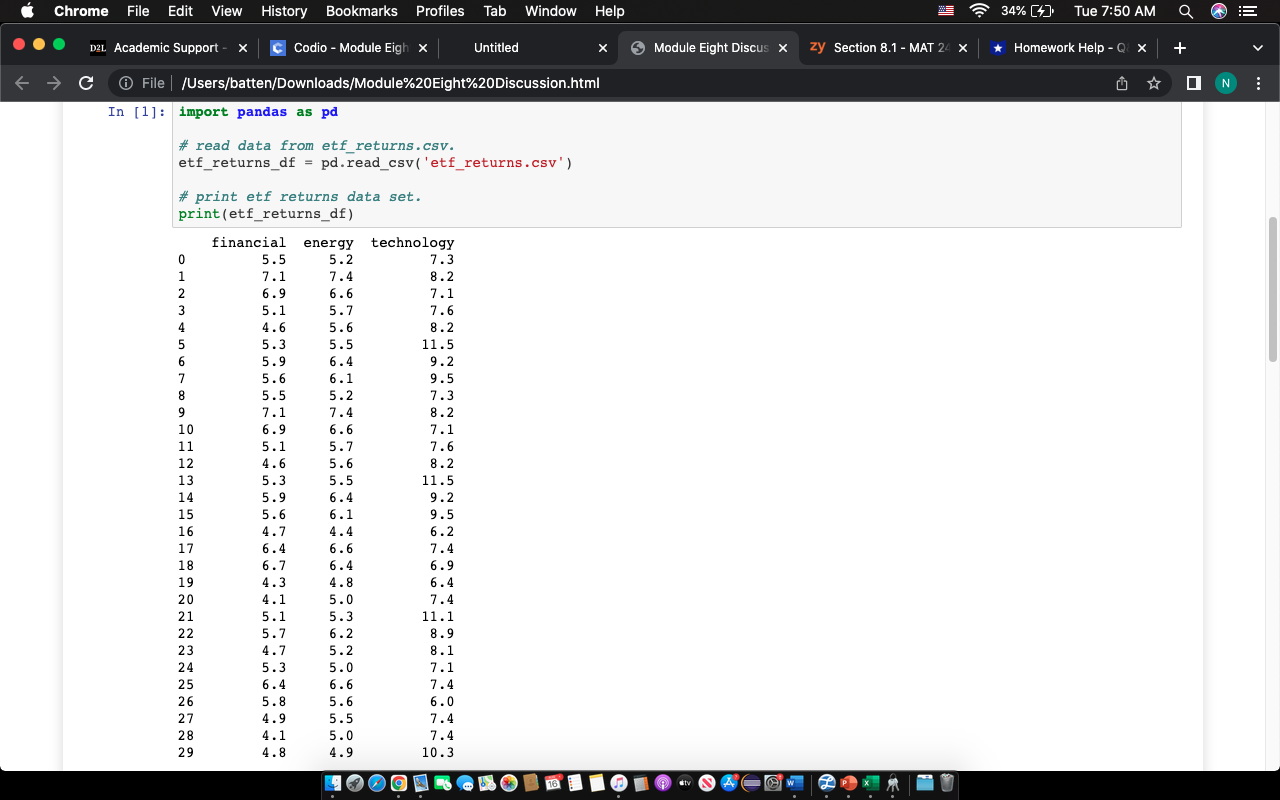
Chrome File Edit View History Bookmarks Profiles Tab Window Help 34% [;]. Tue 7:50 AM Q D2L Academic Support - X CCodio - Module Eigh X Untitled X Module Eight Discus x zy Section 8.1 - MAT 24 X Homework Help - Q x C O File | /Users/batten/Downloads/Module%20Eight%20Discussion.html 0 N In [1] : import pandas as pd # read data from etf_returns.csv. etf_returns_df = pd. read_csv( 'etf_returns.csv' ) # print etf returns data set. print(etf_returns_df) financial energy technology 5.5 5.2 7.3 7. 1 7.4 8. 2 6.9 6.6 7.1 5 . 1 5 .7 7.6 4.6 5.6 8.2 5 .3 5 .5 11.5 5.9 6.4 9.2 5.6 6.1 9.5 5 .5 5.2 7.3 7. 1 7.4 8. 2 6.9 6.6 7.1 11 5 .1 5 . 7 7.6 12 4.6 5.6 8.2 13 5 .3 5.5 11.5 14 5.9 6.4 9.2 15 5 .6 6.1 9.5 16 4.7 4.4 6.2 17 6.4 6.6 7.4 18 6.7 6.4 6.9 19 4.3 4.8 6.4 20 1. 1 5.0 7.4 21 5 . 1 5 .3 11 . 1 22 5 . 7 6.2 8.9 23 4.7 5.2 8.1 24 5 .3 5.0 7.1 25 6.4 6.6 7.4 26 5 . 8 5.6 6.0 27 4.9 5.5 7.4 28 4. 1 5.0 7.4 29 4. 8 4.9 10.3Chrome File Edit View History Bookmarks Profiles Tab Window Help 34% [;]. Tue 7:50 AM Q E D21 Academic Support - x Codio - Module Eigh X Untitled X Module Eight Discus x zy Section 8.1 - MAT 24 X Homework Help - Q x + C O File | /Users/batten/Downloads/Module%20Eight%20Discussion.html N 29 4.8 4.9 10.3 Step 2: Performing one-way ANOVA The scipy.stats submodule can be used to perform one-way analysis of variance (ANOVA). The method f_oneway is used to perform this test. The inputs are individual dataframes of all groups (in this discussion, groups are sectors). Click the block of code below and hit the Run button above. In [2] : import scipy . stats as st # save return data for individual sectors for input to f_oneway method. etf_returns_financial = etf_returns_df[ 'financial' ] etf_returns_energy = etf_returns_df[ energy' ] etf_returns_technology = etf_returns_df[ 'technology' ] # print the outputs: the test statistic and the P-value. test_statistic, p_value = st. f_oneway (etf_returns_financial, etf_returns_energy, etf_returns_technology) print ( "test statistic =", round(test_statistic, 2) ) print( "P-value =", round(p_value, 4) ) test statistic = 55.07 P-value = 0.0 Step 3: Visualizing differences There are post-hoc tests available that can be used to identify groups that are significantly different than others. Alternatively, a quick approach to identifying differences is to create a visual plot for data distributions using side-by-side boxplots. The block of code below uses the seaborn module and matplotlib. submodule to create side-by-side boxplots for the ten-year returns of ETFS in financial, energy, and technology sectors. Click the block of code below and hit the Run button above. 16Chrome File Edit View History Bookmarks Profiles Tab Window Help 34% Tue 7:51 AM Q E D2L Academic Support - X CCodio - Module Eigh X Untitled X Module Eight Discus x zy Section 8.1 - MAT 24 X Homework Help - Q x + C O File | /Users/batten/Downloads/Module%20Eight%20Discussion.html O N In [4]: import matplotlib. pyplot as plt import seaborn as sns import numpy as np import random # side-by-side boxplots require the three dataframes to be concatenated and a require variable identifying the type of ETF. etf_returns_financial_df = etf_returns_df [ [ 'financial' ] ] etf_returns_financial_df = etf_returns_financial_df . rename(columns={ "financial": "return"} ) etf_returns_financial_df [ 'ETF' ] = 'financial etf_returns_energy_df = etf_returns_df [ [ 'energy' ] ] etf_returns_energy_df = etf_returns_energy_df . rename (columns={"energy": "return"} ) etf_returns_energy_df [ 'ETF' ] = 'energy etf_returns_technology_df = etf_returns_df [ [ 'technology' ] ] etf_returns_technology_df = etf_returns_technology_df . rename (columns={ "technology": "return"}) etf_returns_technology_df [ 'ETF' ] = 'technology # concatenate dataframes for the three ETFs. all_etfs_df = pd. concat ( (etf_returns_financial_df, etf_returns_energy_df, etf_returns_technology_df) ) # set a title for the plot, x-axis, and y-axis. pit . title( 'Boxplot for comparison', fontsize=20) # prepare the boxplot. sns . boxplot (x="ETF" , y="return" , data=all_etfs_df) # show the plot. pit . show ( ) Boxplot for comparison 11 10Chrome File Edit View History Bookmarks Profiles Tab Window Help 34% Tue 7:51 AM Q E D2L Academic Support - X C Codio - Module Eigh X Untitled X Module Eight Discus x zy Section 8.1 - MAT 24 X Homework Help - Q x + C O File | /Users/batten/Downloads/Module%20Eight%20Discussion.html 0 N # prepare the boxplot. sns . boxplot (x="ETF" ,y="return" , data=all_etfs_df) # show the plot. pit . show ( ) Boxplot for comparison 11 10 return financial energy technology ETF End of initial post Attach the HTML output to your initial post in the Module Eight discussion. The HTML output can be downloaded by clicking File, then Download as, then HTML. Be sure to answer all questions about this activity in the Module Eight discussion. Follow-up posts (due Sunday) Return to the Module Eight discussion to answer the follow-up questions in your response posts to other students. There are no Python scripts to run for follow-up posts
Step by Step Solution
There are 3 Steps involved in it
Step: 1
Get Instant Access to Expert-Tailored Solutions
See step-by-step solutions with expert insights and AI powered tools for academic success
Step: 2
Step: 3
Ace Your Homework with AI
Get the answers you need in no time with our AI-driven, step-by-step assistance