Question
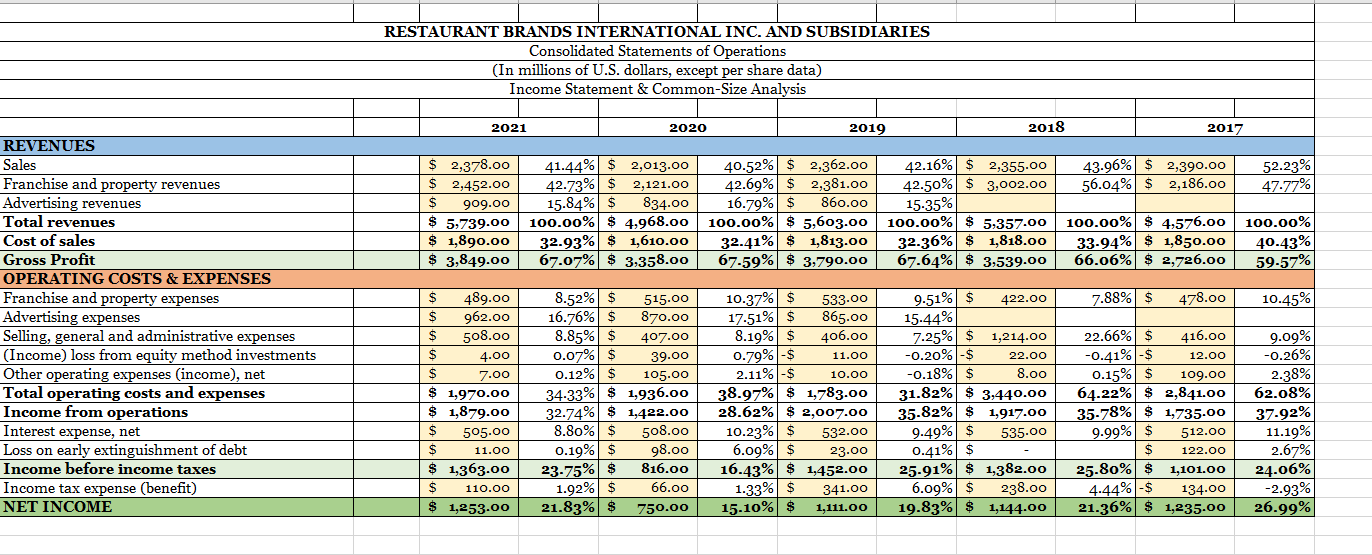
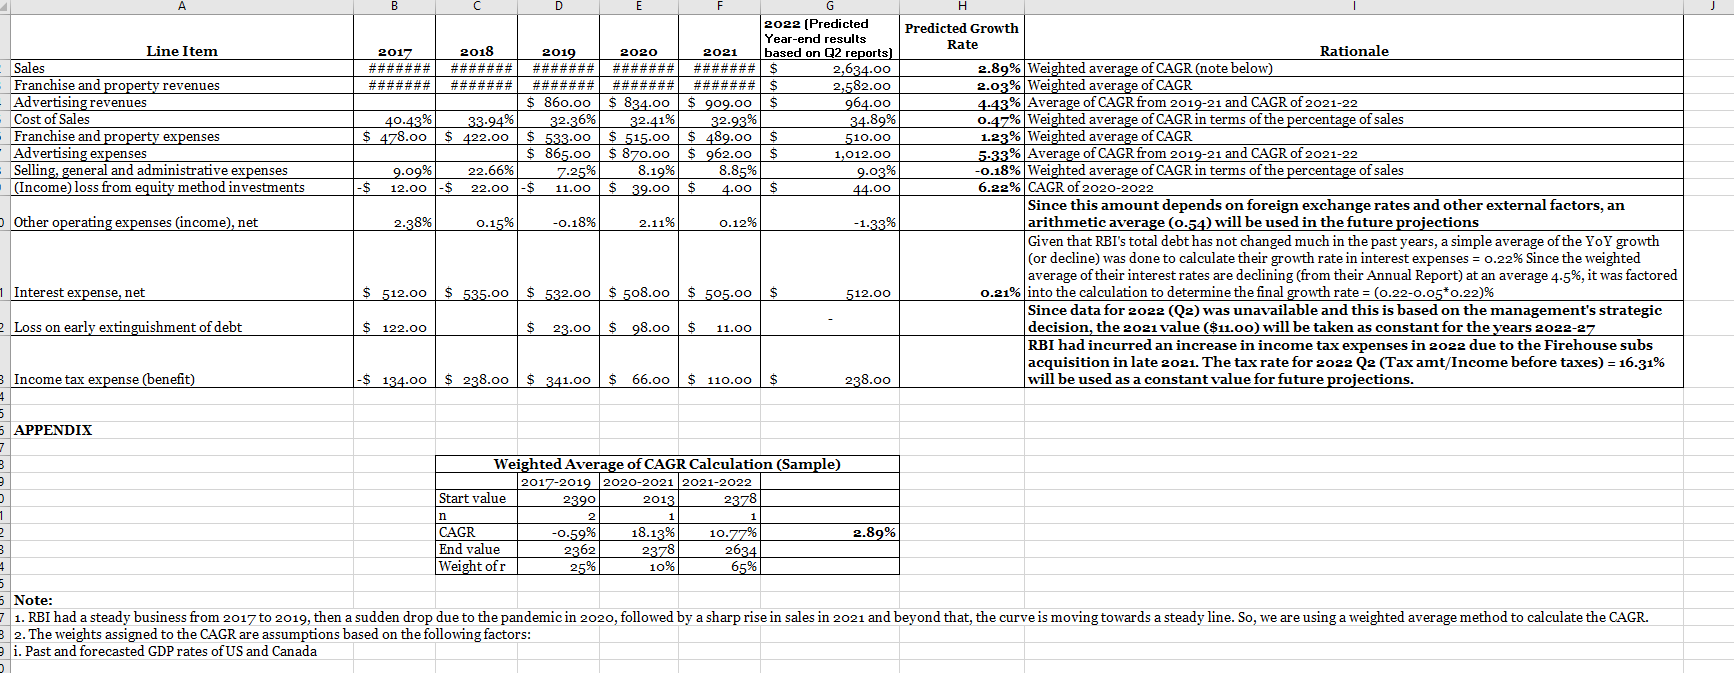
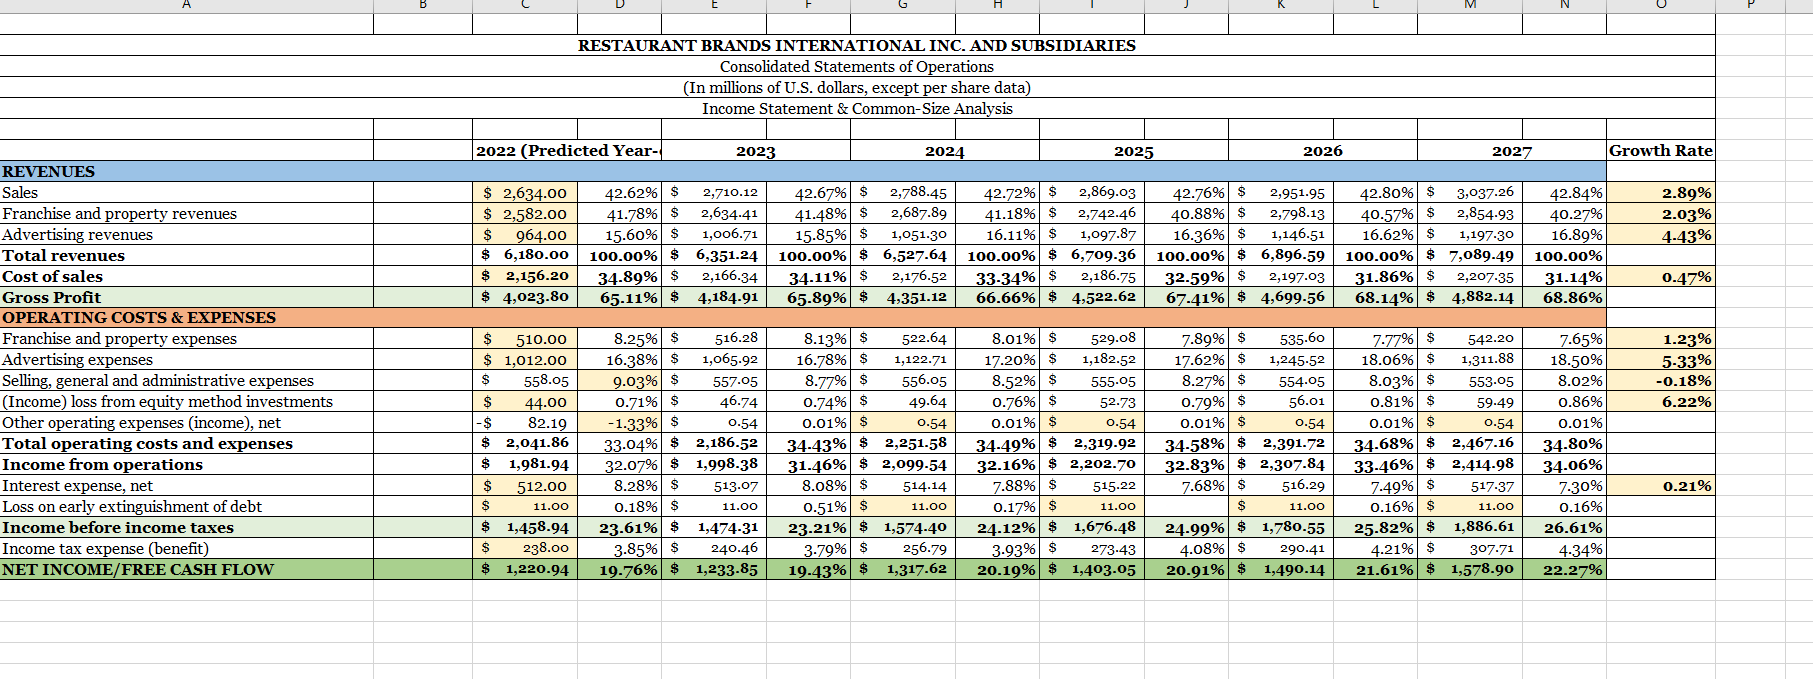
Deliverable 3 (40 marks): Sensitivity Analysis. (Excel) Conduct a simple sensitivity analysis to know the extent by which the companys future profits will be affected


 Deliverable 3 (40 marks): Sensitivity Analysis. (Excel) Conduct a simple sensitivity analysis to know the extent by which the companys future profits will be affected if the assumptions in your projected model change. (20 marks) o You should test 3 alternative scenarios. Each scenario should be presented by way of a copy of your original financial model, with revised input assumptions for each. o Each alternate scenario should be presented within a distinct tab in your Excel file and each tab should be properly labelled. o Each new scenario should each only modify one input/driver variable vs. the base case, such as to reveal that variables true/direct influence. (Word) Identify the key drivers that influence the business. In other words, what are the areas of critical importance which are most deserving of managements attention? Briefly discuss how you have determined this. (10 marks Max 200 words) (Word) Based upon all of your findings above, briefly describe 2 action plans you deem are the best ways to improve the companys valuations. (10 marks Max 200 words)
Step by Step Solution
There are 3 Steps involved in it
Step: 1

Get Instant Access to Expert-Tailored Solutions
See step-by-step solutions with expert insights and AI powered tools for academic success
Step: 2

Step: 3

Ace Your Homework with AI
Get the answers you need in no time with our AI-driven, step-by-step assistance
Get Started


