Answered step by step
Verified Expert Solution
Question
1 Approved Answer
Derive the LM Curve. c. Derive the Aggregate Demand Curve and indicate its slope. (6) d. Derive the Aggregate Supply Curve and determine the sign
Derive the LM Curve. c. Derive the Aggregate Demand Curve and indicate its slope. (6) d. Derive the Aggregate Supply Curve and determine the sign of its slope. (9) e. Determine the effect of an increase in potential GDP (Yp) on output, prices, real interest rates, and employment. Show graphics based on the above model.


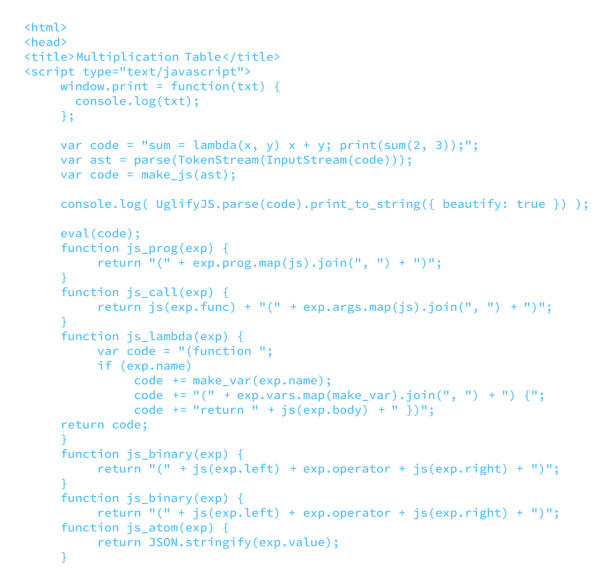
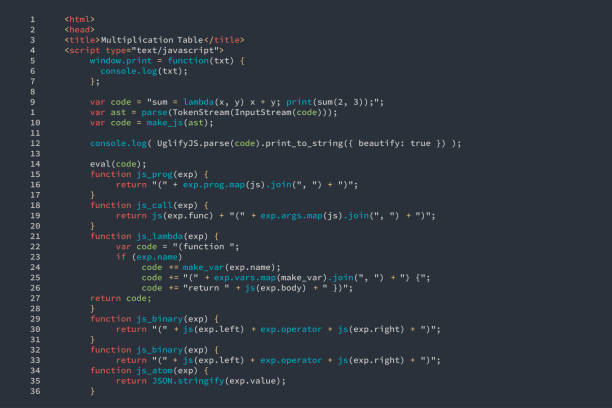
Multiplication Table window.print = function(txt) { console.log(txt); }; var code = "sum = Lambda (x, y) x + y; print (sum(2, 3));"; var ast = parse (TokenStream (InputStream (code))); var code = make_js(ast); console.log( UglifyJS.parse(code).print_to_string({[ beautify: true }) }; eval(code); function js_prog (exp) { return "(" + exp.prog.map(js).join(", ") + ")"; } function js_call(exp) { return js(exp.func) + "(" + exp.args.map(js).join(", ")+")"; } function js_lambda (exp) { var code = "(function"; if (exp.name) code +make_var (exp.name); code += "(" + exp.vars.map (make_var).join(", ")+") {"; code += "return " + js(exp.body) + " })"; return code; } function js_binary(exp) { return "(" + js(exp.left) + exp.operator + js(exp.right) + ")"; } function js_binary (exp) { return "(" + js(exp.left) + exp.operator + js(exp.right) + ")"; function js_atom (exp) { return JSON.stringify (exp.value);
Step by Step Solution
There are 3 Steps involved in it
Step: 1

Get Instant Access to Expert-Tailored Solutions
See step-by-step solutions with expert insights and AI powered tools for academic success
Step: 2

Step: 3

Ace Your Homework with AI
Get the answers you need in no time with our AI-driven, step-by-step assistance
Get Started


