Answered step by step
Verified Expert Solution
Link Copied!

Question

1 Approved Answer

Description: This program is part 2 of the Average-Bar Chart program. You should be building on last week's AvgBar.cpp Instead of reading the numbers directly
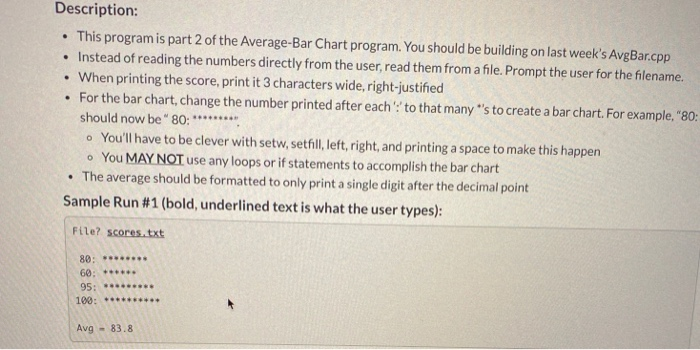
image text in transcribed
Description: This program is part 2 of the Average-Bar Chart program. You should be building on last week's AvgBar.cpp Instead of reading the numbers directly from the user, read them from a file. Prompt the user for the filename. When printing the score, print it 3 characters wide, right-justified For the bar chart, change the number printed after each to that many "'s to create a bar chart. For example, "80: should now be" 80:********* You'll have to be clever with setw, sethill, left, right, and printing a space to make this happen You MAY NOT use any loops or if statements to accomplish the bar chart The average should be formatted to only print a single digit after the decimal point Sample Run #1 (bold, underlined text is what the user types): File? scores.txt 80: "* 60: 95: 100: Avg - 83.8

Step by Step Solution

There are 3 Steps involved in it

Step: 1

blur-text-image

Get Instant Access to Expert-Tailored Solutions

See step-by-step solutions with expert insights and AI powered tools for academic success

Step: 2

blur-text-image

Step: 3

blur-text-image

Ace Your Homework with AI

Get the answers you need in no time with our AI-driven, step-by-step assistance

Get Started

Recommended Textbook for

Genomes Browsers And Databases Data Mining Tools For Integrated Genomic Databases

Authors: Peter Schattner

1st Edition

0521711320, 978-0521711326

More Books

Students also viewed these Databases questions

Question

3. Define the attributions we use to explain behavior

Answered: 1 week ago