Answered step by step
Verified Expert Solution
Question
1 Approved Answer
Determinants of security value include company profitability, operating growth, and risk. The first determinant was covered in Step 1. In Step 2 we complete our


Determinants of security value include company profitability, operating growth, and risk. The first determinant was covered in Step 1. In Step 2 we complete our analysis with:
(a) cost of capital (debt, equity, weighted) and
(b)growth forecast using internal measurements and external data from industry, and macroeconomic analysis.
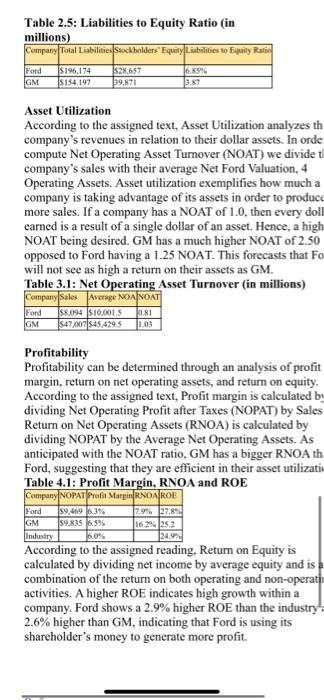
Company Cash Marketable Securities Accounts Receivables Quick Ratio $101.975 1.68 $14,272 $20,904 $15,238 58.163 $8.337 8.44 0.72 Ford GM Industry Based on these findings Ford Motor Company and General Motors are both safe short-term investment; the difference li in inventory values and prepaid assets. Capital Structure and Solvency A company's total debt to equity ratio gives the stockholder good idea of the risk they are going to make if looking to inv According to the assigned text, the total debt to equity ratio equals all long-term debt plus all short-term debt, divided by stockholders' equity. "This ratio is a measure of solvency, indicating whether or not a company can generate sufficient to repay long term obligations." (Easton, 2020, ) Ford Motor Company and General Motors both hold more debt than equi Table 2.1: Total Debt to Equity Ratio (in millions) Company Long Term Debt Short Term Debt Stockholders' Equity Total Debt to Equity Ratio 4.70 1.58 2.36 Ford GM $120,731 $43,549 Industry Ford's debt to equity ratio is three times General Motors' rat and roughly 1.5 times that of the industry, suggesting the company relies more heavily on debt financing than most competitors. "Too much borrowing is risky in that borrowed money must be repaid with interest. The level of debt a comp can effectively manage is directly related to the stability and reliability of its operating cash flows." (Easton, 2020,) $13,902 $19.562 Table 2.2: Operating vs. Non-Operating Return (in millions) Company ROERNOA Non-Operating Return Ford 27.8 7.9% 19.8% GM 25.2% 16.2% 9.0% Industry 24.9% $28,657 $38,871 Table 2.3: Debt to Assets Ratio (in millions) Company Total Assets Debt to Assets EBIT Interest Expense Ford $224,925 0.60 GM $194,520 0.32 Ford GM $7,993 $8,017 Table 2.4: EBITDA Coverage Ratio (in millions) Company Depreciation + EBIT Interest Expense EBITDA Coverage Amortization Ratio 25.60 37.52 $11,0255773 $8,161 5442 $11,025 $773 $8,161 5443
Step by Step Solution
★★★★★
3.41 Rating (185 Votes )
There are 3 Steps involved in it
Step: 1
Step 3 Calculate the Cost of Capital The cost of capital is the weighted average cost of debt and eq...
Get Instant Access to Expert-Tailored Solutions
See step-by-step solutions with expert insights and AI powered tools for academic success
Step: 2

Step: 3

Ace Your Homework with AI
Get the answers you need in no time with our AI-driven, step-by-step assistance
Get Started


