determine a valuation from the income statement stubs
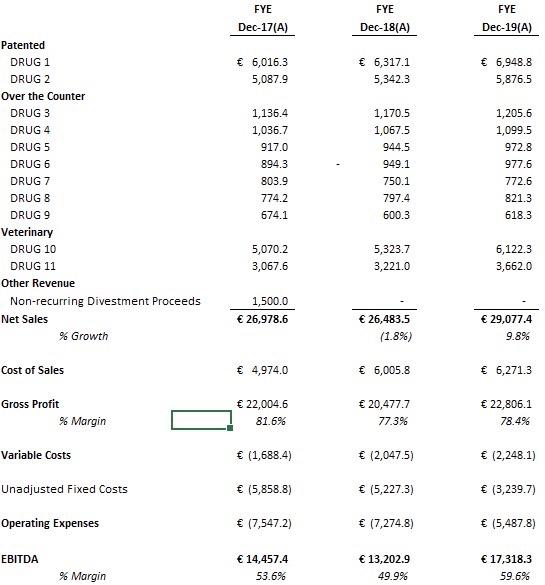
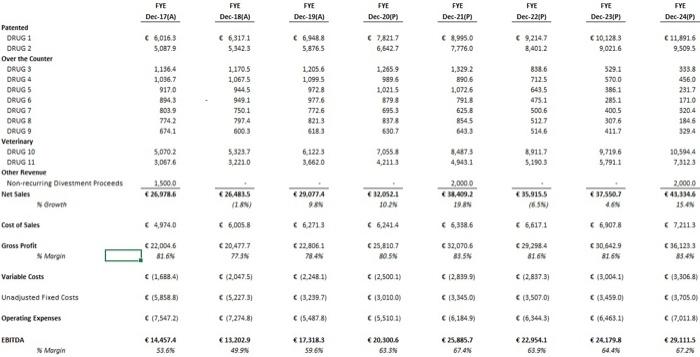
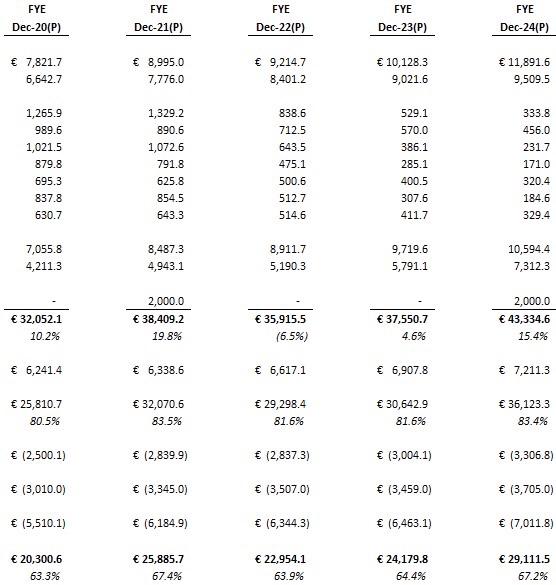
Using this portion of the income statement showing 3 actual years and a 5 year projection, determine a valuation for the pharmaceutical company. There are multiple approaches available:
- Assume an EBITDA multiple of 13.25 to determine EV
or
- conduct a DCF valuation using the five year projection

FYE Dec-17(A) FYE Dec 18A FYE Dec-19(A) FYE Dec-2007 FYE Dec-2107 FYE Dec-221P) FYE Dec-2013 FYE Dec 24/01 C 6,0163 5,087.9 6,3171 5.342.3 6,9488 5.876.5 67,8217 6,642.7 8,995.0 7,776,0 9,214,7 3,4012 10,1283 9.021.6 11.8916 9,5095 Patented DRUG1 DRUG 2 Over the Counter DRUGS DRUG 4 DRUG 5 DRUG6 DRUG 7 DRUGA DRUG 9 Veterinary DRUG 10 DRUG 11 Other Revenue Non recurrine Divestment Proceeds Net Sales Growth 1.136.4 1,036,7 9170 8943 803.9 7742 6741 1.170.5 1,067.5 9445 949.1 7501 7974 6003 12056 1.0995 9728 977.6 7726 8213 6183 1.2659 9896 1,0215 8798 6953 8378 6307 1,329.2 890,6 1,072,6 7918 6258 545 6433 8386 712.5 643.5 475.1 500.6 5127 514,6 529.1 5700 3851 2851 400.5 3076 4117 3338 4560 2317 1710 320.4 1846 3294 5,070.2 3,067.6 6,122.3 3,6620 7,0558 4,2113 8,4875 4,943.1 8,9117 5.190.3 9,719.6 5,7911 30,5944 7,3123 3.221.0 1.000 26.978.6 264815 2.0000 41.3346 35.915.5 2.000.0 18,409.2 TAN 29,077 A 98 12.05.2.1 102N 37.550.7 46N Cost of Sales 4,9740 6,005,8 66.2713 6,2414 6,358.6 6,6171 66.907.8 7,2113 Gross Profit Mergin 22,004.6 IN 20,477,7 7735 22.8061 784 25,810.7 OSN 32,0706 835N 29,2984 816 30.5429 816N 36,1233 83 Variable costs (1,688.4 2,047.51 (2.248.1) 12,500.1) 12,839.9 (2,837.31 15.004.11 13,3068) Unadjusted Fixed Costs (5,858.81 (5.227.31 (3.239.71 13,0100) 13,345.0) (3,507.01 (5.450.00 19,7050 Operating Expenses (7,547.23 (7.274.81 (5.4878) 15,5101) 16,1849) 16,844.31 (6.463.11 (7,0118) EBITDA Margin 14.457.4 53.65 13.202.9 49.99 17.318.3 59.68 20.300.6 633 3.885.7 67.AN 22.954.1 65.9 24.179.8 64.4 29.1115 67.23 FYE Dec-17(A) FYE Dec-18(A) FYE Dec-19(A) 6,016.3 5,087.9 6,317.1 5,342.3 6,948.8 5,876.5 Patented DRUG 1 DRUG 2 Over the Counter DRUG 3 DRUG 4 DRUG 5 DRUG 6 DRUG 7 DRUG 8 DRUG 9 Veterinary DRUG 10 DRUG 11 Other Revenue Non-recurring Divestment Proceeds Net Sales % Growth 1,136.4 1,036.7 917.0 894.3 803.9 774.2 674.1 1,170.5 1,067.5 944.5 949.1 750.1 797.4 600.3 1,205.6 1,099.5 972.8 977.6 772.6 821.3 618.3 5,070.2 3,067.6 5,323.7 3,221.0 6,122.3 3,662.0 1,500.0 26,978.6 26,483.5 (1.8%) 29,077.4 9.8% Cost of Sales 4,974.0 6,005.8 6,271.3 Gross Profit % Margin 22,004.6 81.6% 20,477.7 77.3% 22,806.1 78.4% Variable Costs (1,688.4) (2,047.5) (2,248.1) Unadjusted Fixed Costs (5,858.8) (5,227.3) (3,239.7) Operating Expenses 17,547.2) 17,274.8) (5,487.8) EBITDA 14,457,4 53.6% 13,202.9 49.9% 17,318.3 59.6% % Margin FYE FYE FYE Dec-20(P) FYE Dec-21(P) FYE Dec-22(P) Dec-23(P) Dec-24(P) 7,821.7 6,642.7 8,995.0 7,776.0 9,214.7 8,401.2 10,128.3 9,021.6 11,891.6 9,509.5 1,265.9 989.6 1,021.5 879.8 695.3 837.8 630.7 1,329.2 890.6 1,072.6 791.8 625.8 854.5 643.3 838.6 712.5 643.5 475.1 500.6 512.7 514.6 529.1 570.0 386.1 285.1 400.5 307.6 411.7 333.8 456.0 231.7 171.0 320.4 184.6 329.4 7,055.8 4,211.3 8,487.3 4,943.1 8,911.7 5,190.3 9,719.6 5,791.1 10,594.4 7,312.3 32,052.1 10.2% 2,000.0 38,409.2 19.8% 35,915.5 (6.5%) 37,550.7 4.6% 2,000.0 43,334.6 15.4% 6,241.4 6,338.6 6,617.1 6,907.8 7,211.3 25,810.7 80.5% 32,070.6 83.5% 29,298.4 81.6% 30,642.9 81.6% 36,123.3 83.4% (2,500.1) (2,839.9) (2,837.3) (3,004.1) (3,306.8) (3,010.0) (3,345.0) (3,507.0) (3,459.0) (3,705.0) (5,510.1) (6,184.9) (6,344.3) (6,463.1) (7,011.8) 20,300.6 63.3% 25,885.7 67.4% 22,954.1 63.9% 24,179.8 64.4% 29,111.5 67.2% FYE Dec-17(A) FYE Dec 18A FYE Dec-19(A) FYE Dec-2007 FYE Dec-2107 FYE Dec-221P) FYE Dec-2013 FYE Dec 24/01 C 6,0163 5,087.9 6,3171 5.342.3 6,9488 5.876.5 67,8217 6,642.7 8,995.0 7,776,0 9,214,7 3,4012 10,1283 9.021.6 11.8916 9,5095 Patented DRUG1 DRUG 2 Over the Counter DRUGS DRUG 4 DRUG 5 DRUG6 DRUG 7 DRUGA DRUG 9 Veterinary DRUG 10 DRUG 11 Other Revenue Non recurrine Divestment Proceeds Net Sales Growth 1.136.4 1,036,7 9170 8943 803.9 7742 6741 1.170.5 1,067.5 9445 949.1 7501 7974 6003 12056 1.0995 9728 977.6 7726 8213 6183 1.2659 9896 1,0215 8798 6953 8378 6307 1,329.2 890,6 1,072,6 7918 6258 545 6433 8386 712.5 643.5 475.1 500.6 5127 514,6 529.1 5700 3851 2851 400.5 3076 4117 3338 4560 2317 1710 320.4 1846 3294 5,070.2 3,067.6 6,122.3 3,6620 7,0558 4,2113 8,4875 4,943.1 8,9117 5.190.3 9,719.6 5,7911 30,5944 7,3123 3.221.0 1.000 26.978.6 264815 2.0000 41.3346 35.915.5 2.000.0 18,409.2 TAN 29,077 A 98 12.05.2.1 102N 37.550.7 46N Cost of Sales 4,9740 6,005,8 66.2713 6,2414 6,358.6 6,6171 66.907.8 7,2113 Gross Profit Mergin 22,004.6 IN 20,477,7 7735 22.8061 784 25,810.7 OSN 32,0706 835N 29,2984 816 30.5429 816N 36,1233 83 Variable costs (1,688.4 2,047.51 (2.248.1) 12,500.1) 12,839.9 (2,837.31 15.004.11 13,3068) Unadjusted Fixed Costs (5,858.81 (5.227.31 (3.239.71 13,0100) 13,345.0) (3,507.01 (5.450.00 19,7050 Operating Expenses (7,547.23 (7.274.81 (5.4878) 15,5101) 16,1849) 16,844.31 (6.463.11 (7,0118) EBITDA Margin 14.457.4 53.65 13.202.9 49.99 17.318.3 59.68 20.300.6 633 3.885.7 67.AN 22.954.1 65.9 24.179.8 64.4 29.1115 67.23 FYE Dec-17(A) FYE Dec-18(A) FYE Dec-19(A) 6,016.3 5,087.9 6,317.1 5,342.3 6,948.8 5,876.5 Patented DRUG 1 DRUG 2 Over the Counter DRUG 3 DRUG 4 DRUG 5 DRUG 6 DRUG 7 DRUG 8 DRUG 9 Veterinary DRUG 10 DRUG 11 Other Revenue Non-recurring Divestment Proceeds Net Sales % Growth 1,136.4 1,036.7 917.0 894.3 803.9 774.2 674.1 1,170.5 1,067.5 944.5 949.1 750.1 797.4 600.3 1,205.6 1,099.5 972.8 977.6 772.6 821.3 618.3 5,070.2 3,067.6 5,323.7 3,221.0 6,122.3 3,662.0 1,500.0 26,978.6 26,483.5 (1.8%) 29,077.4 9.8% Cost of Sales 4,974.0 6,005.8 6,271.3 Gross Profit % Margin 22,004.6 81.6% 20,477.7 77.3% 22,806.1 78.4% Variable Costs (1,688.4) (2,047.5) (2,248.1) Unadjusted Fixed Costs (5,858.8) (5,227.3) (3,239.7) Operating Expenses 17,547.2) 17,274.8) (5,487.8) EBITDA 14,457,4 53.6% 13,202.9 49.9% 17,318.3 59.6% % Margin FYE FYE FYE Dec-20(P) FYE Dec-21(P) FYE Dec-22(P) Dec-23(P) Dec-24(P) 7,821.7 6,642.7 8,995.0 7,776.0 9,214.7 8,401.2 10,128.3 9,021.6 11,891.6 9,509.5 1,265.9 989.6 1,021.5 879.8 695.3 837.8 630.7 1,329.2 890.6 1,072.6 791.8 625.8 854.5 643.3 838.6 712.5 643.5 475.1 500.6 512.7 514.6 529.1 570.0 386.1 285.1 400.5 307.6 411.7 333.8 456.0 231.7 171.0 320.4 184.6 329.4 7,055.8 4,211.3 8,487.3 4,943.1 8,911.7 5,190.3 9,719.6 5,791.1 10,594.4 7,312.3 32,052.1 10.2% 2,000.0 38,409.2 19.8% 35,915.5 (6.5%) 37,550.7 4.6% 2,000.0 43,334.6 15.4% 6,241.4 6,338.6 6,617.1 6,907.8 7,211.3 25,810.7 80.5% 32,070.6 83.5% 29,298.4 81.6% 30,642.9 81.6% 36,123.3 83.4% (2,500.1) (2,839.9) (2,837.3) (3,004.1) (3,306.8) (3,010.0) (3,345.0) (3,507.0) (3,459.0) (3,705.0) (5,510.1) (6,184.9) (6,344.3) (6,463.1) (7,011.8) 20,300.6 63.3% 25,885.7 67.4% 22,954.1 63.9% 24,179.8 64.4% 29,111.5 67.2%


