Determine if the following probability experiments represent binomial experiments. If not, explain why. If a probability experiment is a binomial experiment, state the number of
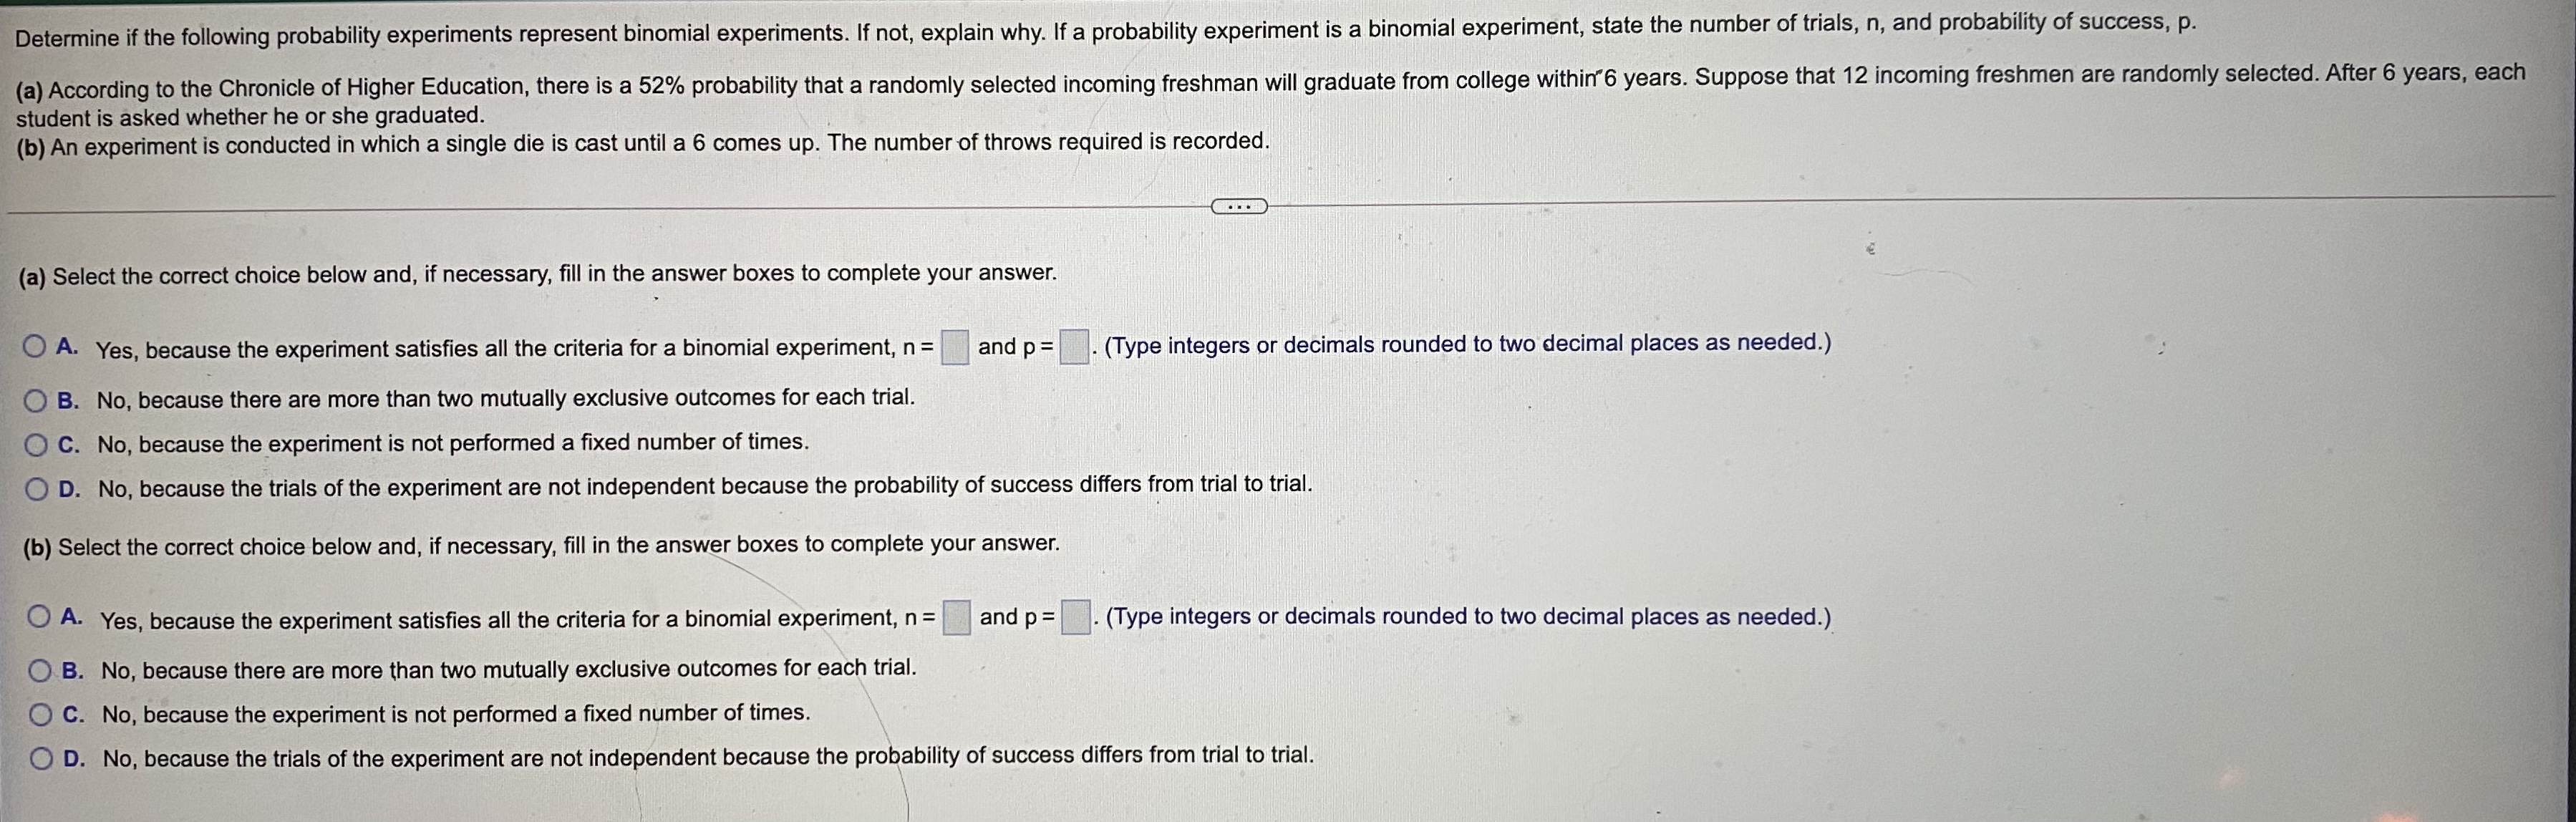
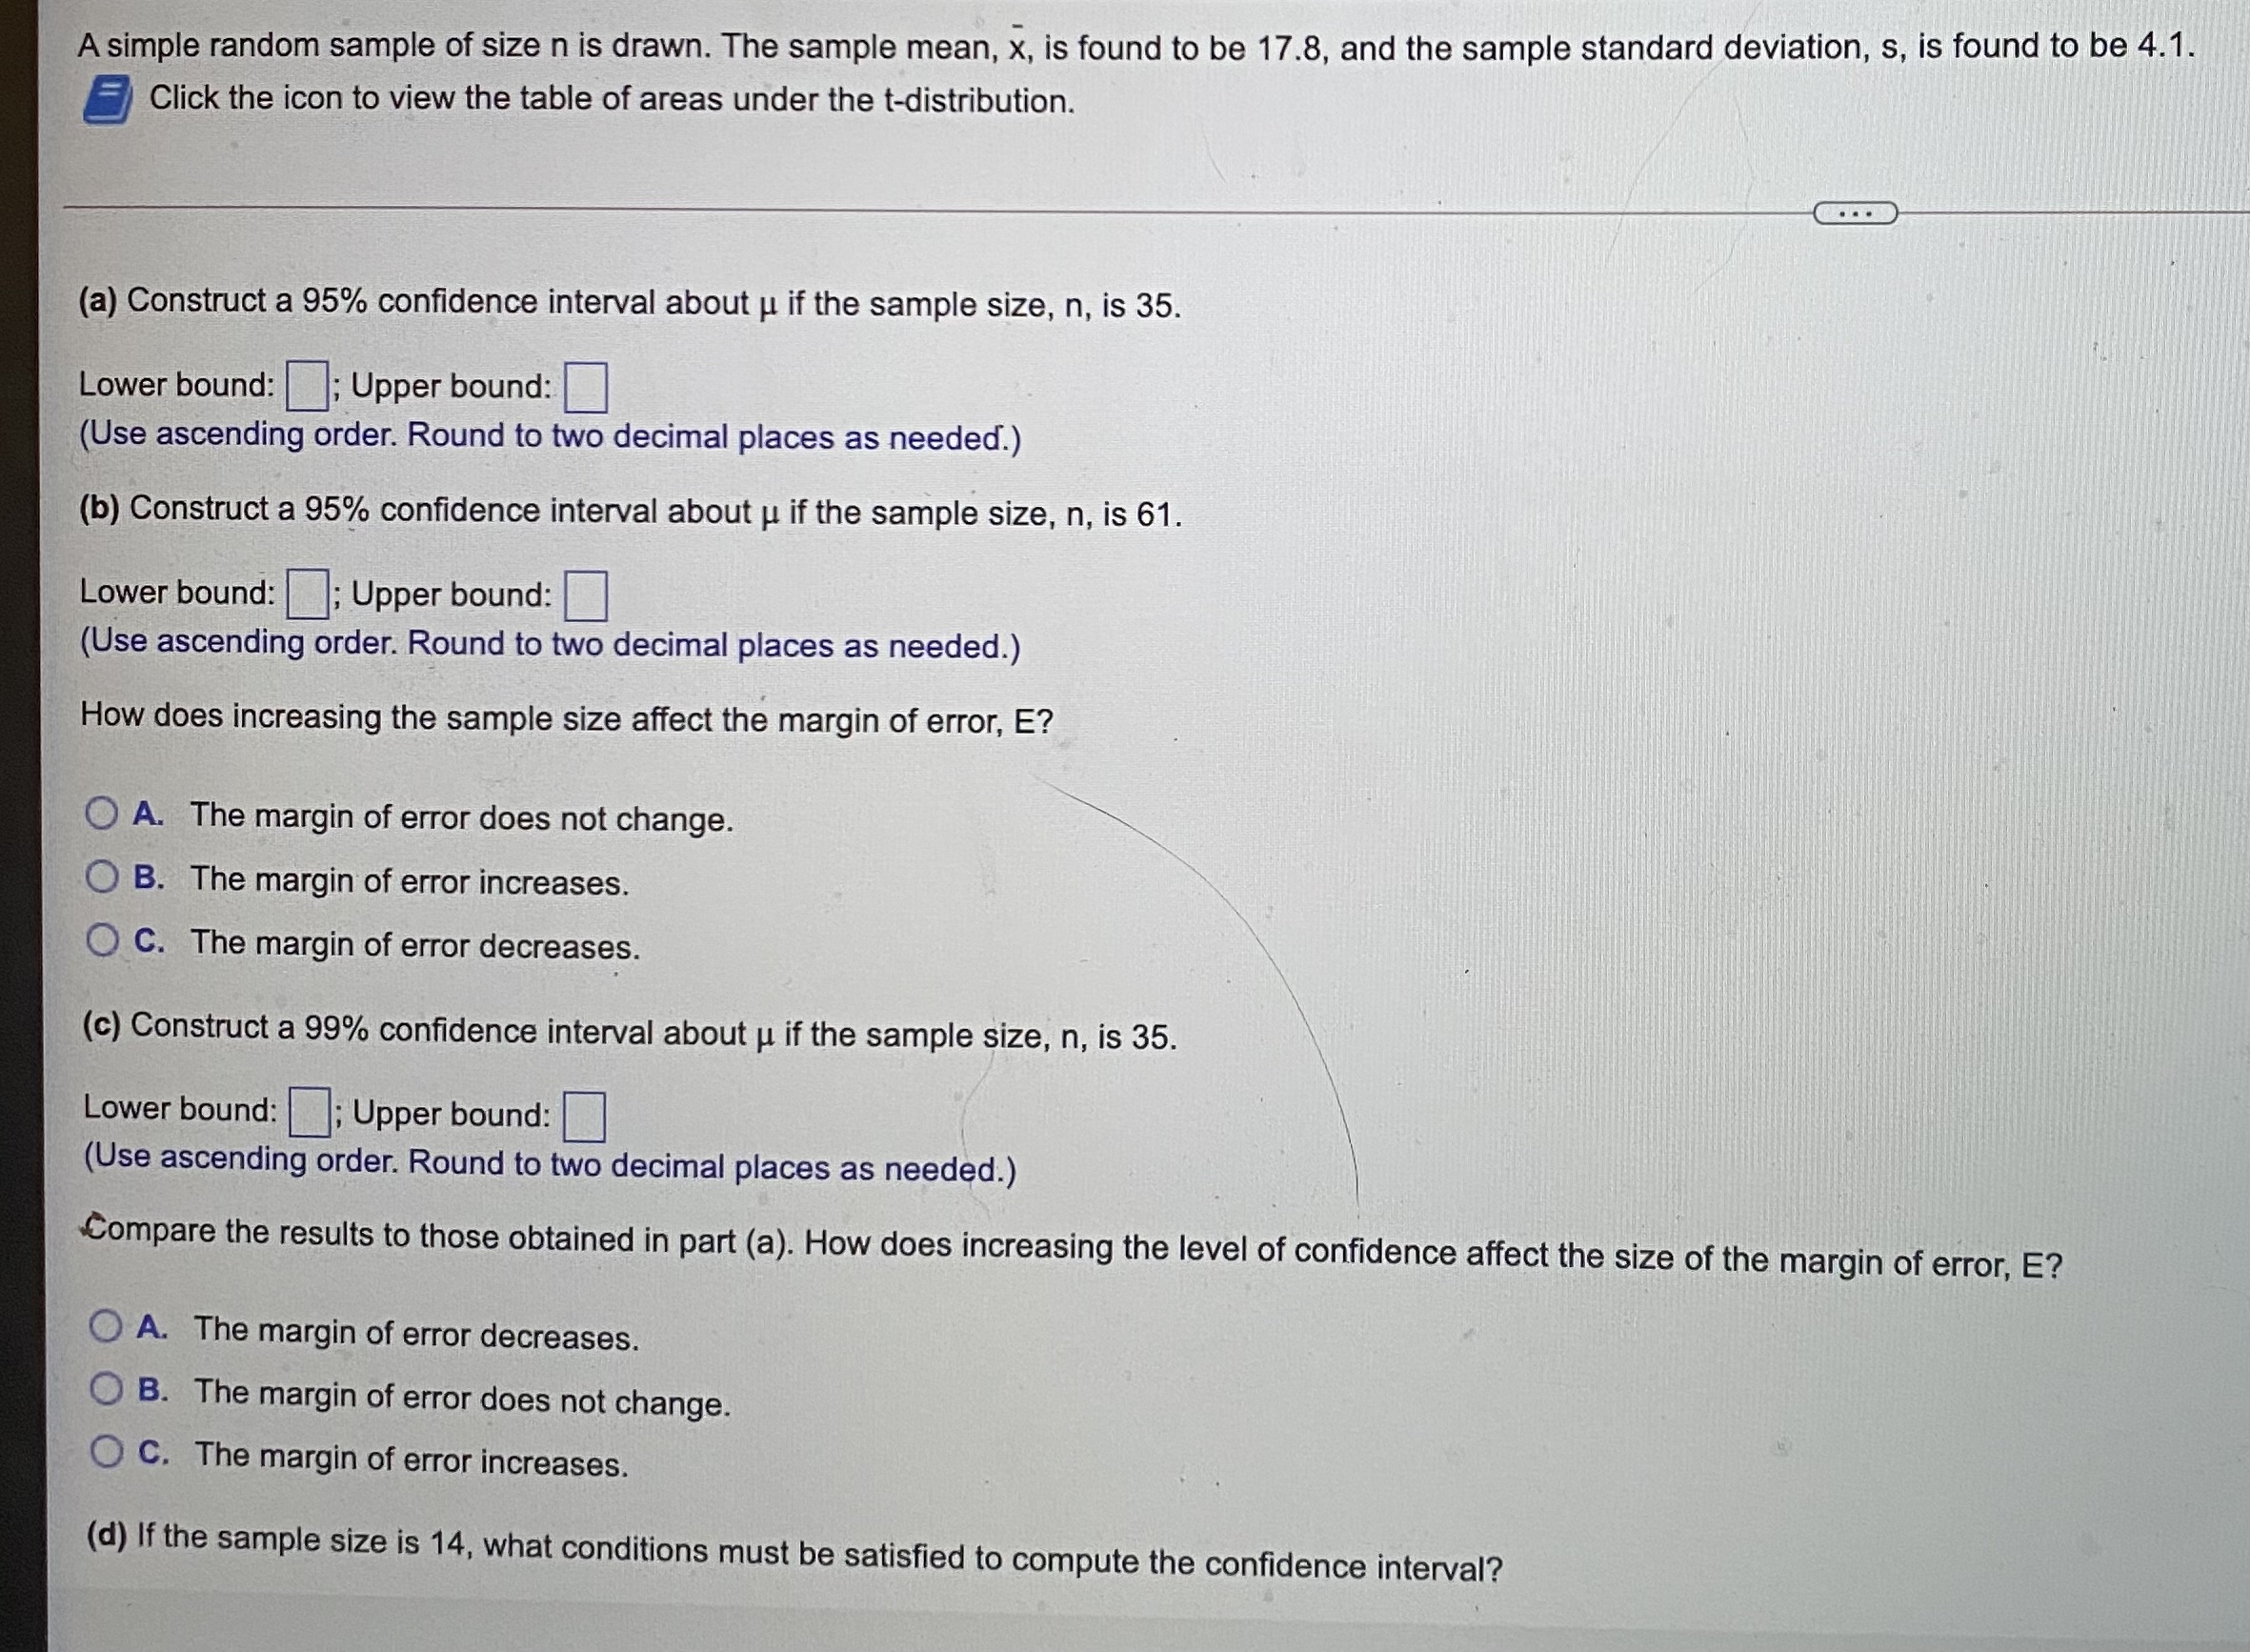
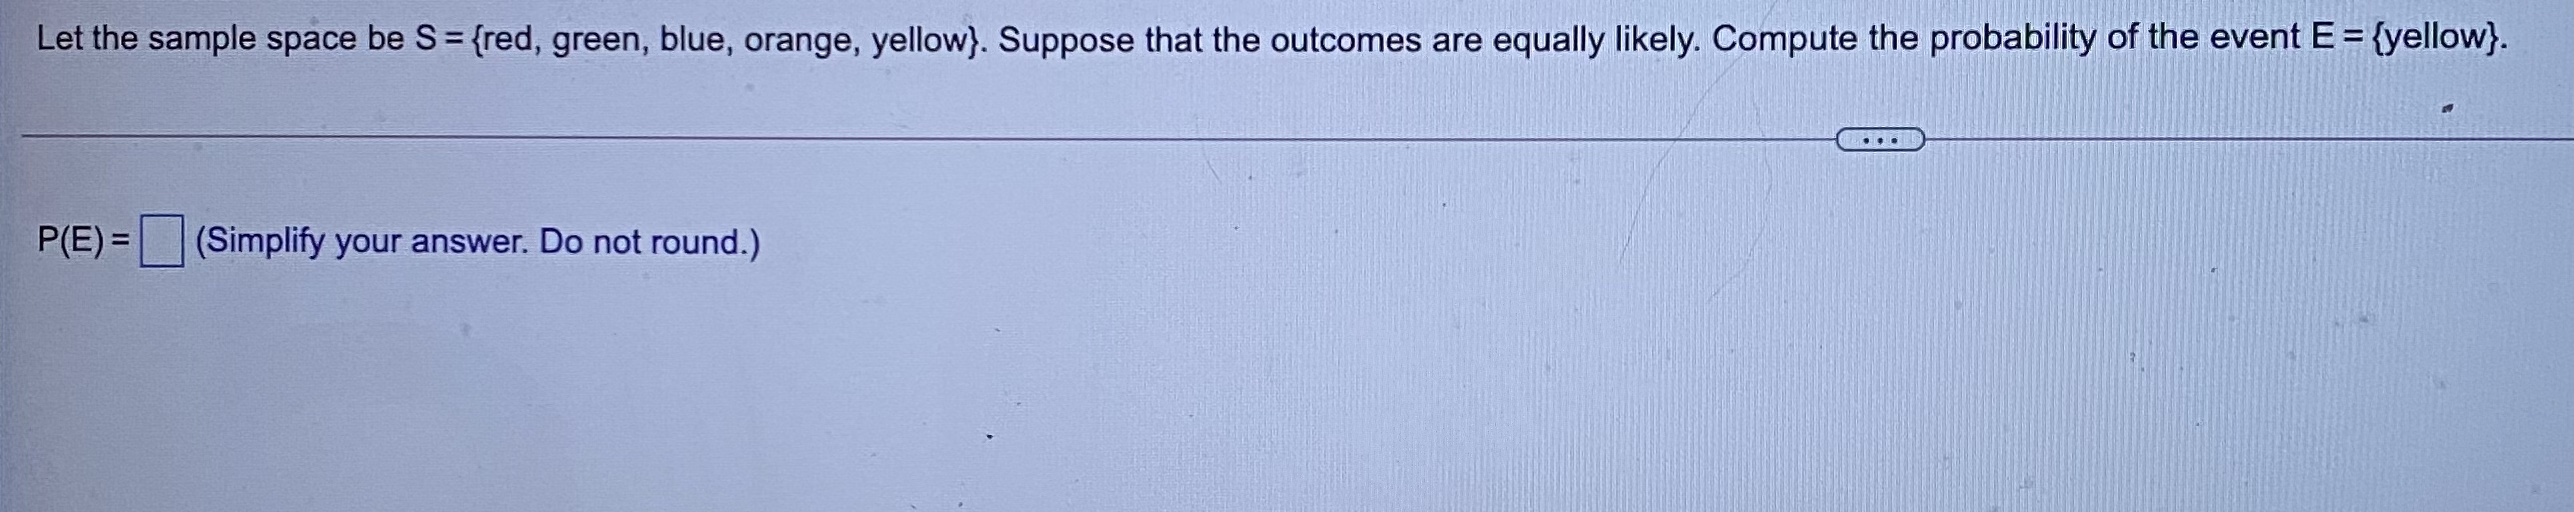
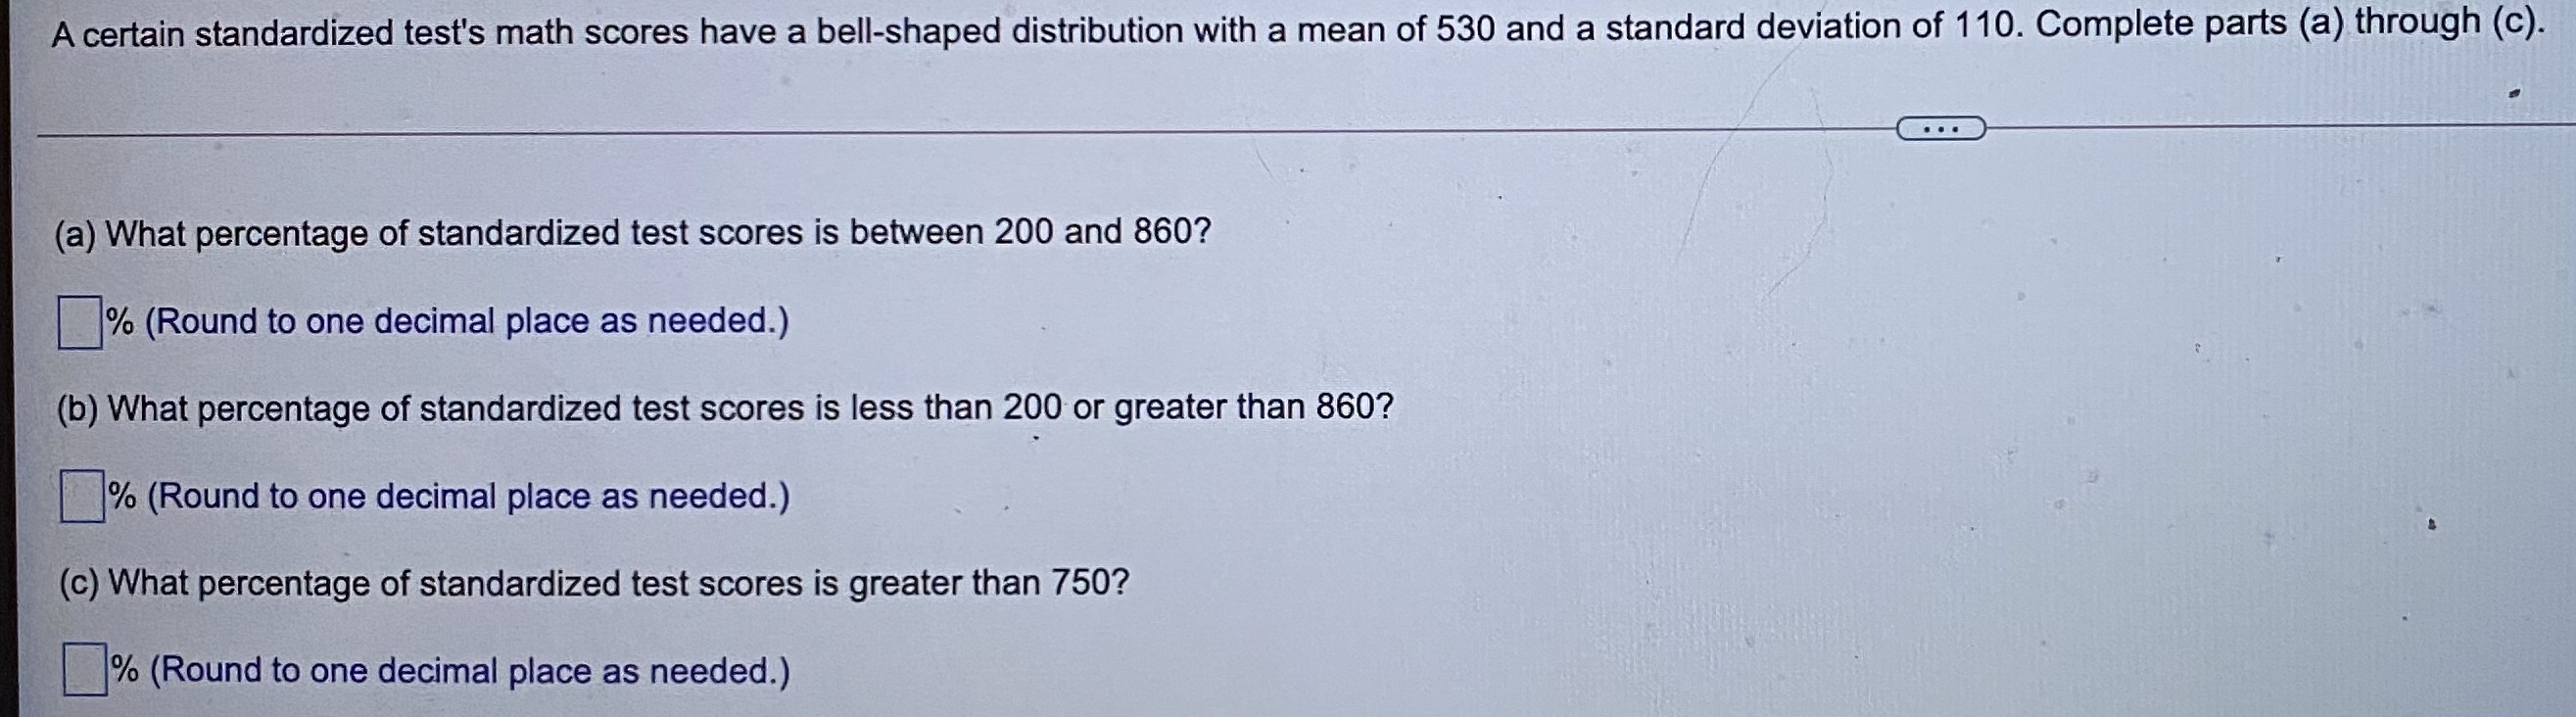
Determine if the following probability experiments represent binomial experiments. If not, explain why. If a probability experiment is a binomial experiment, state the number of trials, n, and probability of success, p. (a) According to the Chronicle of Higher Education, there is a 52% probability that a randomly selected incoming freshman will graduate from college within 6 years. Suppose that 12 incoming freshmen are randomly selected. After 6 years, each student is asked whether he or she graduated. (b) An experiment is conducted in which a single die is cast until a 6 comes up. The number of throws required is recorded. (a) Select the correct choice below and, if necessary, fill in the answer boxes to complete your answer. A. Yes, because the experiment satisfies all the criteria for a binomial experiment, n = |and p = .(Type integers or decimals rounded to two decimal places as needed.) O B. No, because there are more than two mutually exclusive outcomes for each trial. O C. No, because the experiment is not performed a fixed number of times. O D. No, because the trials of the experiment are not independent because the probability of success differs from trial to trial. (b) Select the correct choice below and, if necessary, fill in the answer boxes to complete your answer. A. Yes, because the experiment satisfies all the criteria for a binomial experiment, n = and p = . (Type integers or decimals rounded to two decimal places as needed.) O B. No, because there are more than two mutually exclusive outcomes for each trial. C. No, because the experiment is not performed a fixed number of times. O D. No, because the trials of the experiment are not independent because the probability of success differs from trial to trial.A simple random sample of size n is drawn. The sample mean, x, is found to be 17.8, and the sample standard deviation, s, is found to be 4.1. Click the icon to view the table of areas under the t-distribution. (a) Construct a 95% confidence interval about u if the sample size, n, is 35. Lower bound: ; Upper bound: (Use ascending order. Round to two decimal places as needed.) (b) Construct a 95% confidence interval about u if the sample size, n, is 61. Lower bound: ; Upper bound: (Use ascending order. Round to two decimal places as needed.) How does increasing the sample size affect the margin of error, E? O A. The margin of error does not change. O B. The margin of error increases. O C. The margin of error decreases. (c) Construct a 99% confidence interval about u if the sample size, n, is 35. Lower bound: ; Upper bound: (Use ascending order. Round to two decimal places as needed.) Compare the results to those obtained in part (a). How does increasing the level of confidence affect the size of the margin of error, E? A. The margin of error decreases. O B. The margin of error does not change. O C. The margin of error increases. (d) If the sample size is 14, what conditions must be satisfied to compute the confidence interval?Let the sample space be S = {red, green, blue, orange, yellow). Suppose that the outcomes are equally likely. Compute the probability of the event E = {yellow}. P(E) = (Simplify your answer. Do not round.)A certain standardized test's math scores have a bell-shaped distribution with a mean of 530 and a standard deviation of 110. Complete parts (a) through (c). (a) What percentage of standardized test scores is between 200 and 860? (Round to one decimal place as needed.) (b) What percentage of standardized test scores is less than 200 or greater than 860? % (Round to one decimal place as needed.) (c) What percentage of standardized test scores is greater than 750? % (Round to one decimal place as needed.)
Step by Step Solution
There are 3 Steps involved in it
Step: 1
Get Instant Access to Expert-Tailored Solutions
See step-by-step solutions with expert insights and AI powered tools for academic success
Step: 2
Step: 3
Ace Your Homework with AI
Get the answers you need in no time with our AI-driven, step-by-step assistance