

Question
Determine the average rate of change in the winning time between 1964 and 2004 The following graph shows the fare rates for the Tortoise Taxi
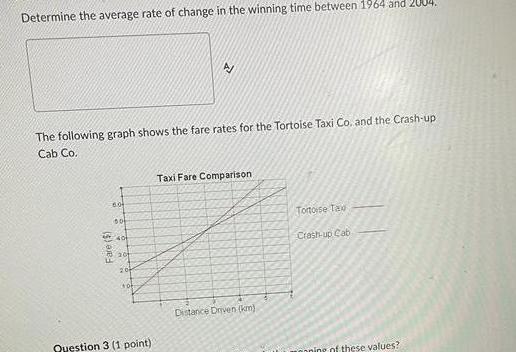

Determine the average rate of change in the winning time between 1964 and 2004 The following graph shows the fare rates for the Tortoise Taxi Co and the Crash up Cab Co 60 60 401 201 20 tot Question 3 1 point Taxi Fare Comparison Distance Driven km Tortoise Tax Crash up Cab noning of these values
Step by Step Solution
There are 3 Steps involved in it
Step: 1

Get Instant Access to Expert-Tailored Solutions
See step-by-step solutions with expert insights and AI powered tools for academic success
Step: 2

Step: 3
Ace Your Homework with AI
Get the answers you need in no time with our AI-driven, step-by-step assistance
Get Started
Discrete Mathematics Elementary And Beyond
Authors: L Lovasz, J Pelikan, K L Vesztergombi
1st Edition
6610010021, 9786610010028