Question
Determine whether each of the following represents a population or a sample. No written submission required. The salaries of 50 randomly selected employees in a
- Determine whether each of the following represents a population or a sample.
No written submission required.
The salaries of 50 randomly selected employees in a company. | |
All 15,000 boxes of chocolate produced during a production shift. | |
All the homes in a city whose property taxes are over $10,000. | |
The political affiliation of all registered voters in a city. |
Option 1: Population
Option 2: Sample
- Marital status.
Nominal
Ordinal
Interval
Ratio
- The rate of return on sales.
Qualitative
Quantitative (Discrete)
Quantitative (Continuous)
- A polytechnic has four campuses. The VP of academics want to evaluate students' reactions to a recent change in the Learning Management System. She requests that her research team randomly select 20 students from each campus to be interviewed.
Simple Random Sampling
Systematic Sampling
Stratified Random Sampling
Cluster Sampling
Convenience Sampling
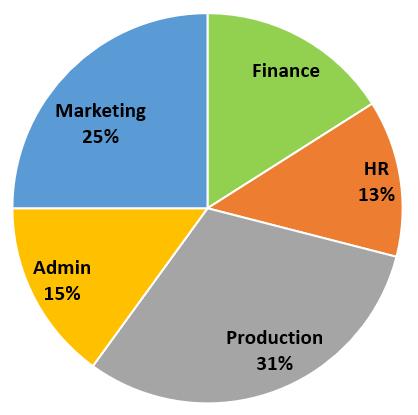
- The proportion of employees in each department at Attrev Ltd is displayed in the chart below:

Suppose there are 1,200 employees (full-time and part-time) in the company.
No written submission required.
a. What percentage of the employees are in Finance?
%
b. How many employees are in Production or Marketing?
employees
c. How many employees are neither in Finance nor in HR?
employees
d. If 25% of Production employees work part-time, how many Production employees work full-time?
employees
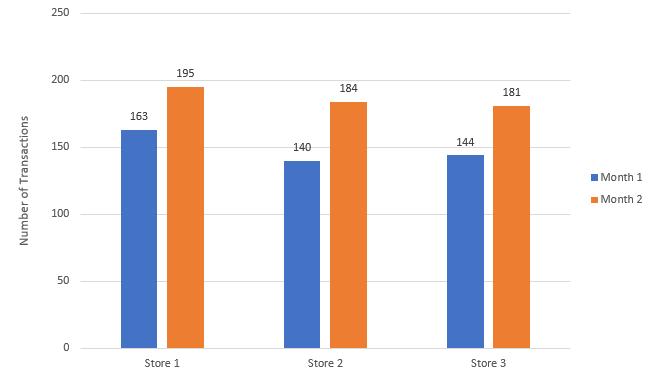
- The owner of Blackstone Inc. opened 3 stores in different parts of the city and would like to compare the number of sales transactions made after 2 months of operation. The number of sales transactions at the 3 stores are displayed in the chart below:

No written submission required.
a. What type of chart is being used to compare the data?
b. Fill in the following two-way frequency table for the data.
Store 1 | Store 2 | Store 3 | Total | |
Month 1 | ||||
Month 2 | ||||
Total |
c. How many transactions were made in the first month?
d. How many transactions were made in total (in both months at all 3 stores)?
e. What percent of the total transactions were made by Store 3?
%
Round to one decimal place
f. What percent of the total transactions were made by Store 3 in Month 2?
%
Round to one decimal place
g. What percent of the transactions at Store 2 were made in Month 1?
%
Round to one decimal place
h. What percent of the transactions in Month 1 were made at Store 2?
%
Round to one decimal place
i. Which store has the highest percentage increase from Month 1 to Month 2?
Option 1: Store 1, Option 2: Store 2, Option 3: Store 3
- The following split back-to-back stem-and-leaf plot shows the monthly insurance premiums paid by a sample of 62 students based on their location (23 from the South and 39 from the North) in the same city. Note that each leaf entry has two digits.
South | North | |
79 78 74 69 67 54 | 1 | |
42 41 36 33 20 13 07 | 2 | 02 05 10 18 22 24 28 36 |
94 90 72 68 | 2 | 51 55 60 66 72 73 81 85 89 92 |
20 17 | 3 | 15 15 16 18 28 29 44 |
84 84 | 3 | 69 76 80 90 96 |
48 07 | 4 | 10 27 32 43 |
4 | 55 76 97 | |
5 | 24 45 |
No written submission required.
Key: 07 | 2 | 02 means $207 monthly insurance premium for a student in the South and $202 for a student in the North
a. What is the highest monthly premium paid by a student in the North?
b. What is the lowest monthly premium paid by a student in the South?
c. How many Northern students pay at least $400 monthly?
d. What percent of Southern students pay less than $300 monthly?
%
Round to two decimal places
e. For Northern students, what is the frequency of the $300 to under $350 class?
f. What is the total monthly payment for all Southern students in the $300 to under $350 class?
g. For the entire data (North and South combined), what is the cumulative frequency of the $200 to under $250 class?
h. For Northern students, what is the cumulative frequency of the $500 to under $550 class?
i. Is the distribution for students from the South symmetric, skewed right or skewed left?
Option 1: Symmetric, Option 2: Skewed Right, Option 3: Skewed Left
j. Is the distribution for students from the North symmetric, skewed right or skewed left?
Option 1: Symmetric, Option 2: Skewed Right, Option 3: Skewed Left
- Fill in the missing cells in the following grouped frequency distribution table:
No written submission required.
Round to two decimal places when necessary
Class | Midpoint | Frequency | Relative Frequency | Cumulative Frequency | Cumulative Relative Frequency |
0 to < 20 | 8.82% | 3 | % | ||
20 to < 40 | % | 12 | % | ||
40 to < 60 | % | 20 | % | ||
60 to < 80 | % | 24 | % | ||
80 to < 100 | % | 34 | 100.00% |
9. The year-end dividend yields (%) for a sample of 48 top-performing stocks are shown in the table below:
2.8 | 4.2 | 2.6 | 3.3 | 5.8 | 3.9 |
5.7 | 3.0 | 5.0 | 2.6 | 2.8 | 2.5 |
3.3 | 4.0 | 2.7 | 2.6 | 4.9 | 3.3 |
3.1 | 4.6 | 4.9 | 4.5 | 5.5 | 2.6 |
5.2 | 3.0 | 3.1 | 2.8 | 2.7 | 5.0 |
5.4 | 4.7 | 4.8 | 3.0 | 3.6 | 3.5 |
3.4 | 3.9 | 3.8 | 3.4 | 3.9 | 2.6 |
2.6 | 2.9 | 2.7 | 4.2 | 3.7 | 3.2 |
Complete this question in Excel and submit your spreadsheet for marking.
a. Fill in the following frequency table using the data.
Dividend Yield | Frequency |
2.5 to < 3.0 | |
3.0 to < 3.5 | |
3.5 to < 4.0 | |
4.0 to < 4.5 | |
4.5 to < 5.0 | |
5.0 to < 5.5 | |
5.5 to < 6.0 | |
Total | 48 |
b. What is the frequency of the 3.0 to < 3.5 interval?
c. What proportion of the dividend yields are at least 4.0% but less than 5.0%?
%
Round to two decimal places
d. What proportion of the dividend yields are less than 4.0%?
%
Round to two decimal places
e. Suppose a stock is rated A if its dividend yield is 4.0% or higher and rated B if the yield is less than 4.0%. What proportion of B-rated stocks in this sample have dividend yields less than 3.0%?
%
Round to two decimal places
f. Create the appropriate chart in Excel for the frequency table in (a). Your chart should be complete and labeled for full marks.
Leave this box blank
- The following chart lists the top 10 cosmetic procedures performed in the United States in 2019.
Procedure | Frequency |
Breast Augmentation | 299,715 |
Liposuction | 265,209 |
Eyelid Surgery | 211,005 |
Nose Reshaping | 207,284 |
Face Lift | 123,685 |
Tummy Tuck | 123,427 |
Breast Lift | 113,188 |
Dermabrasion | 77,366 |
Neck Lift | 54,852 |
Breast Reduction | 46,340 |
Complete this question in Excel and submit your spreadsheet for marking.
a. What type/level of data is the cosmetic procedure data? Justify your answer. [2]
b. Create an appropriate chart in Excel to illustrate the distribution of cosmetic procedures in the United States. Your chart should be complete and labeled for full marks. [3]
c. What percentage of the cosmetic procedures were "lifts"? [1]
Leave this box blank
Marketing 25% Admin 15% Finance Production 31% HR 13% Number of Transactions 250 200 150 100 50 0 163 195 Store 1 140 184 Store 2 144 181 Store 3 Month 1 Month 2
Step by Step Solution
3.44 Rating (157 Votes )
There are 3 Steps involved in it
Step: 1
Determine whether each of the following represents a population or a sample No written submission required The salaries of 50 randomly selected employees in a company click to select Population Sample ...
Get Instant Access to Expert-Tailored Solutions
See step-by-step solutions with expert insights and AI powered tools for academic success
Step: 2

Step: 3

Document Format ( 1 attachment)
6295b3a301a04_testSTAT1.docx
120 KBs Word File
Ace Your Homework with AI
Get the answers you need in no time with our AI-driven, step-by-step assistance
Get Started


