Question
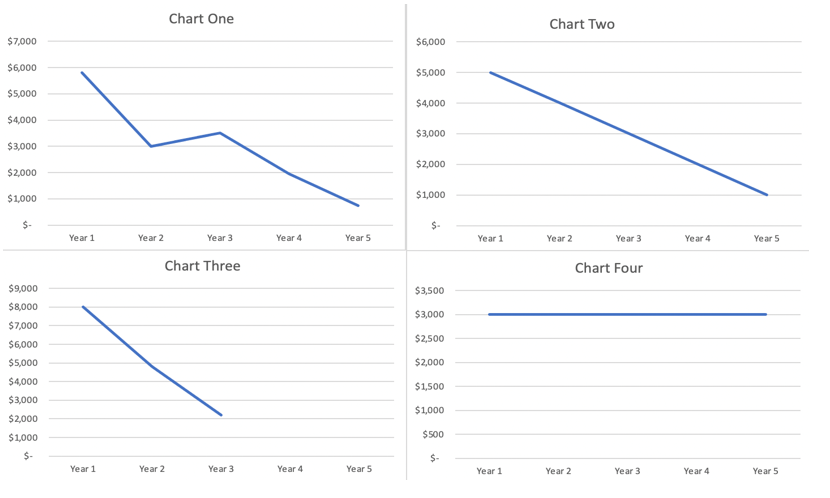
Determining the Method Used to Produce a Depreciation Visualization The Excel file associated with this exercise includes four charts depicting depreciation under four different methods
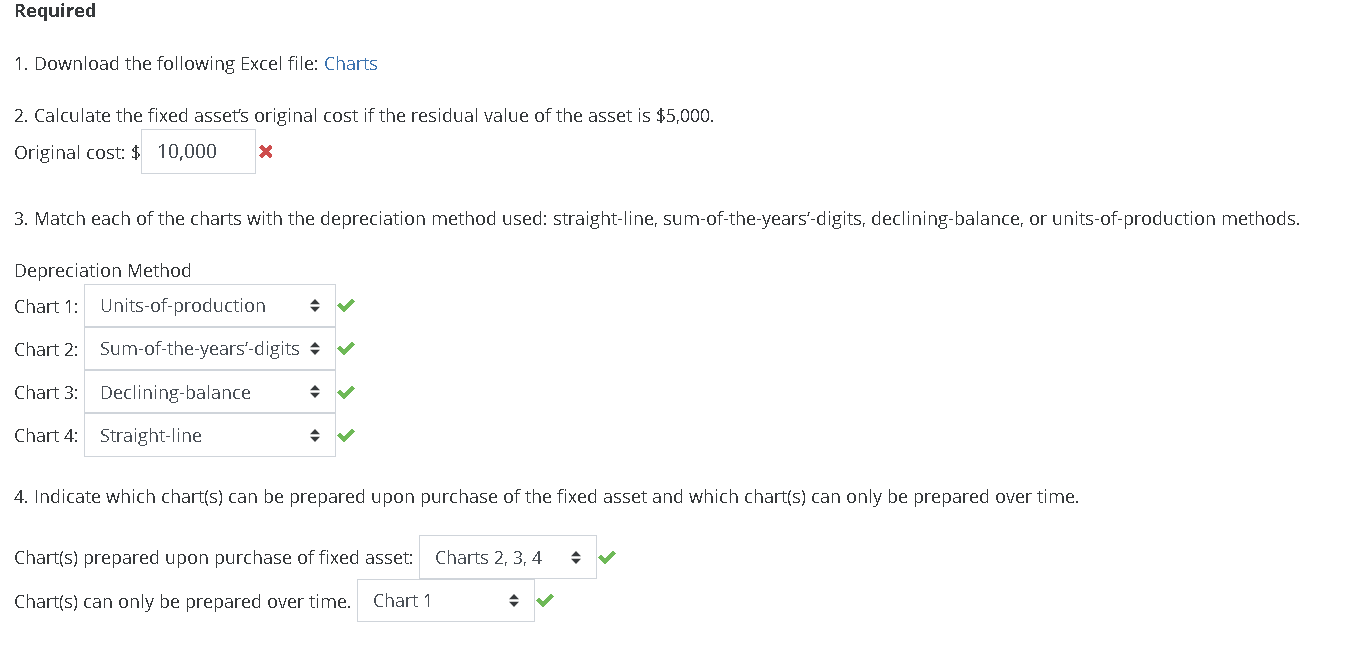
Determining the Method Used to Produce a Depreciation Visualization The Excel file associated with this exercise includes four charts depicting depreciation under four different methods over the life of a fixed asset with a useful life of five years. In this exercise, we match each depreciation method provided to the appropriate depreciation chart based upon the trend in depreciation over the five year period. Required 1. Download the following Excel file: Charts 2. Calculate the fixed assets original cost if the residual value of the asset is $5,000.
Question is 2. Calculate the fixed asset's original cost if the residual value of asset is $5000.

charts used: 
Step by Step Solution
There are 3 Steps involved in it
Step: 1

Get Instant Access to Expert-Tailored Solutions
See step-by-step solutions with expert insights and AI powered tools for academic success
Step: 2

Step: 3

Ace Your Homework with AI
Get the answers you need in no time with our AI-driven, step-by-step assistance
Get Started


