

Answered step by step
Verified Expert Solution
Question
1 Approved Answer
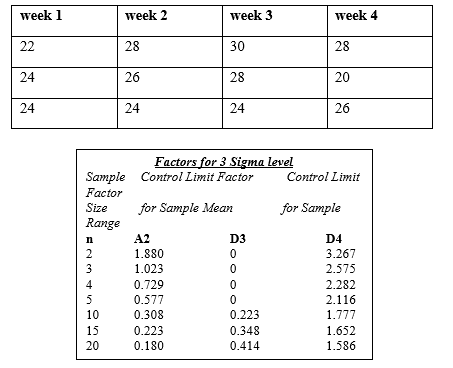
Develop 3 sigma level process control charts for monitoring weight of bags that contain apples. You performed 4 weeks of samplings with 3 observations each
- Develop 3 sigma level process control charts for monitoring weight of bags that contain apples. You performed 4 weeks of samplings with 3 observations each (n = 3). Calculate and show values for UCL, CL, and LCL using the table (do not calculate standard deviation, use the table below). Draw control chart(s). Discuss your findings. Is everything okay?
Step by Step Solution
There are 3 Steps involved in it
Step: 1

Get Instant Access to Expert-Tailored Solutions
See step-by-step solutions with expert insights and AI powered tools for academic success
Step: 2

Step: 3
Ace Your Homework with AI
Get the answers you need in no time with our AI-driven, step-by-step assistance
Get Started
Handbook For Surviving The Global Financial Crisis
Authors: Barbara Goldsmith
1st Edition
1514811995, 978-1514811993