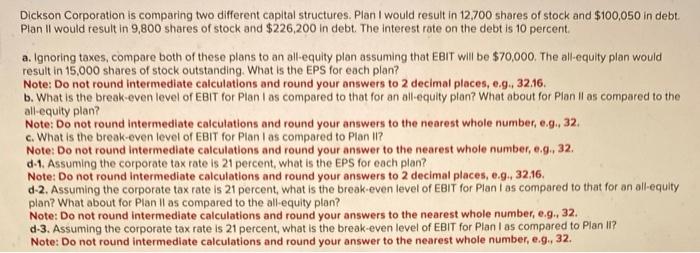
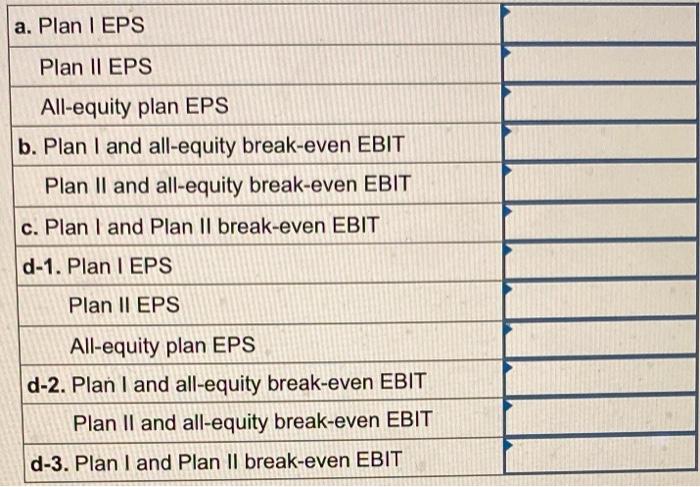
Dickson Corporation is comparing two different capital structures. Plan I would result in 12,700 shares of stock and $100,050 in debt. Plan II would result in 9,800 shares of stock and $226,200 in debt. The interest rate on the debt is 10 percent. a. Ignoring taxes, compare both of these plans to an all-equity plan assuming that EBIT will be $70,000. The all-equity plan would result in 15,000 shares of stock outstanding. What is the EPS for each plan? Note: Do not round intermediate calculations and round your answers to 2 decimal places, e.9. 32.16. b. What is the break-even level of EBIT for Plan I as compared to that for an all-equity plan? What about for Plan Il as compared to the all-equity plan? Note: Do not round intermediate calculations and round your answers to the nearest whole number, e.g. 32. c. What is the break-even level of EBIT for Plan I as compared to Plan II? Note: Do not round intermediate calculations and round your answer to the nearest whole number, e.9. 32. d-1. Assuming the corporate tax rate is 21 percent, what is the EPS for each plan? Note: Do not round intermediate calculations and round your answers to 2 decimal places, e.9. 32.16. d-2. Assuming the corporate tax rate is 21 percent, what is the break-even level of EBIT for Plan l as compared to that for an all-equity plan? What about for Plan Il as compared to the all-equity plan? Note: Do not round intermediate calculations and round your answers to the nearest whole number, e.9. 32. d-3. Assuming the corporate tax rate is 21 percent, what is the break-even level of EBIT for Plan I as compared to Plan II? Note: Do not round intermediate calculations and round your answer to the nearest whole number, e.9. 32. \begin{tabular}{|l|} \hline a. Plan I EPS \\ \hline Plan II EPS \\ \hline All-equity plan EPS \\ \hline b. Plan I and all-equity break-even EBIT \\ \hline Plan II and all-equity break-even EBIT \\ \hline c. Plan I and Plan II break-even EBIT \\ \hline d-1. Plan I EPS \\ \hline Plan II EPS \\ \hline All-equity plan EPS \\ \hline d-2. Plan I and all-equity break-even EBIT \\ \hline Plan II and all-equity break-even EBIT \\ \hline d-3. Plan I and Plan II break-even EBIT \\ \hline \end{tabular}


