Answered step by step
Verified Expert Solution
Question
1 Approved Answer
Did the company maintain the current ratio of 1.5 & Coverage ratio of 1.5? We have already answered this question. What is the long-term debt-to-total
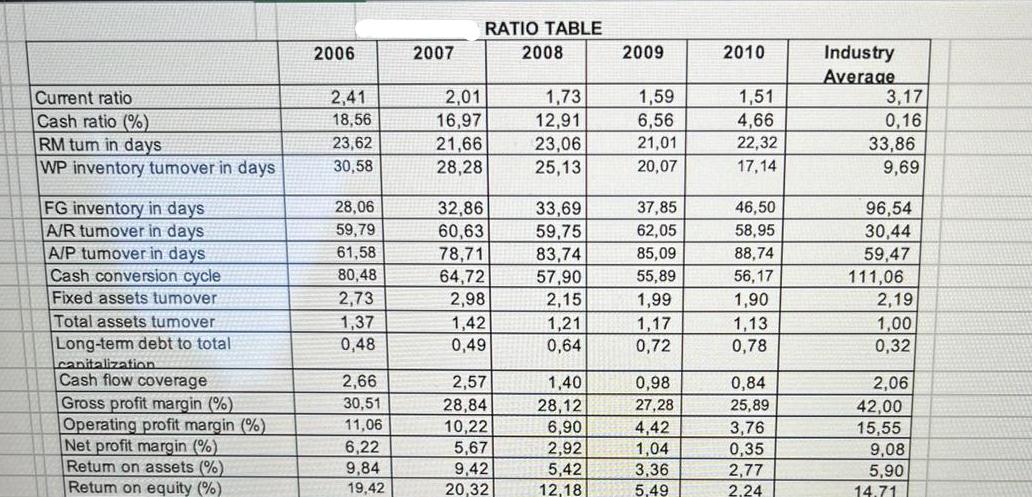
- Did the company maintain the current ratio of 1.5 & Coverage ratio of 1.5? We have already answered this question.
- What is the long-term debt-to-total capitalization in 2010? Was it higher or lower than the required ratio of 60%?
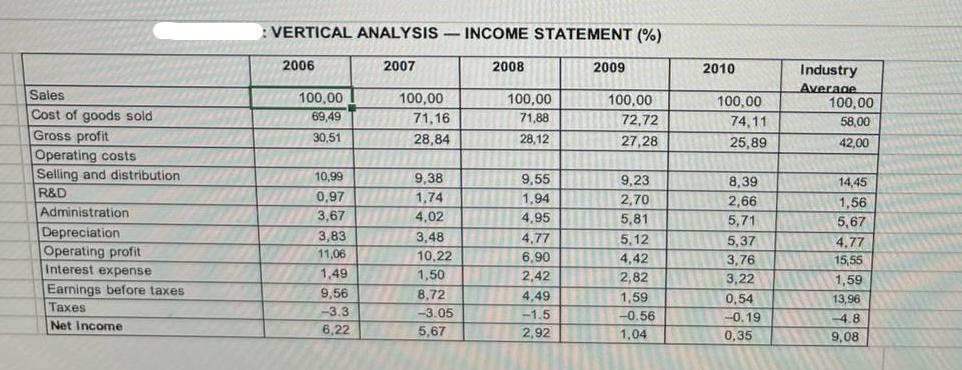
- The ROE in 2010 was 2.24% (industry 14.71). Analyze this ratio
- The ROA in 2010 was 2.77 % (industry 5.9). Analyze this ratio.
- The gross profit margin in 2010 was 25.89% (the industry was 42), and the operating profit margin in 2010 was 3.76% (industry 15.55). What does that mean?
- Will the bank Confirm and approve the loans? Why?
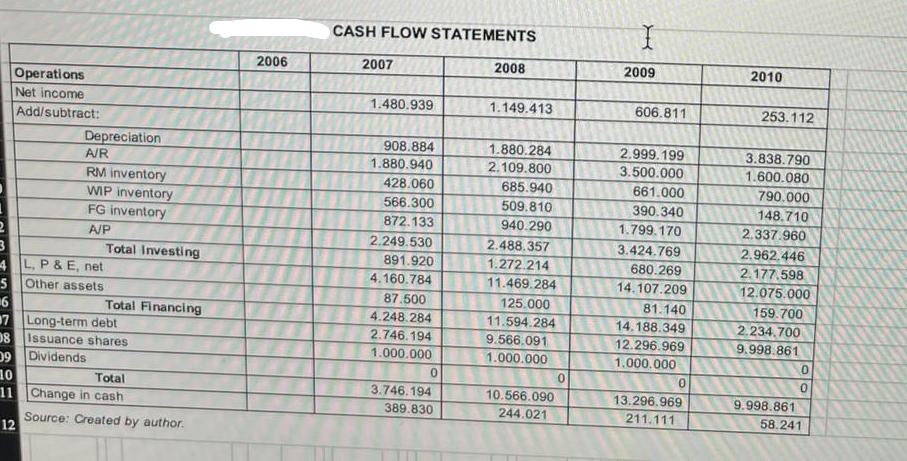
- Did the company pay dividends?
- How many shares does the company have?
- If the company must stop one of its production lines, which product will be the one to be stopped? Why?
- Would you recommend opening a new factory in Winnipeg? Why?
- Would you recommend producing fencing as Eagle requested?
- Is there any action to be taken with Eagle? Explain?
- Delisle pays a 10% premium to the dealer. Why?
- Accounts receivable,30% RM, 40% WIP, and 50% FG inventory. Explain
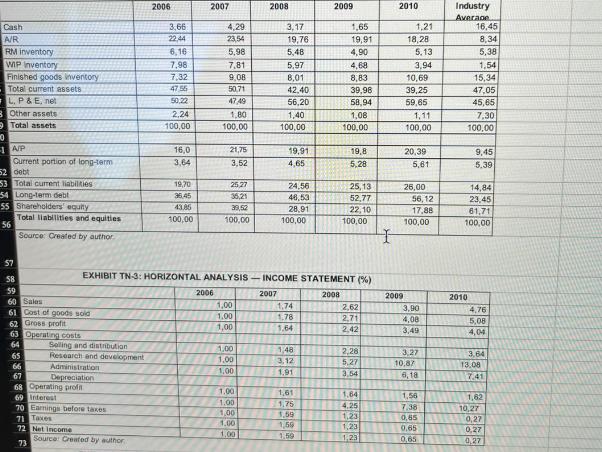
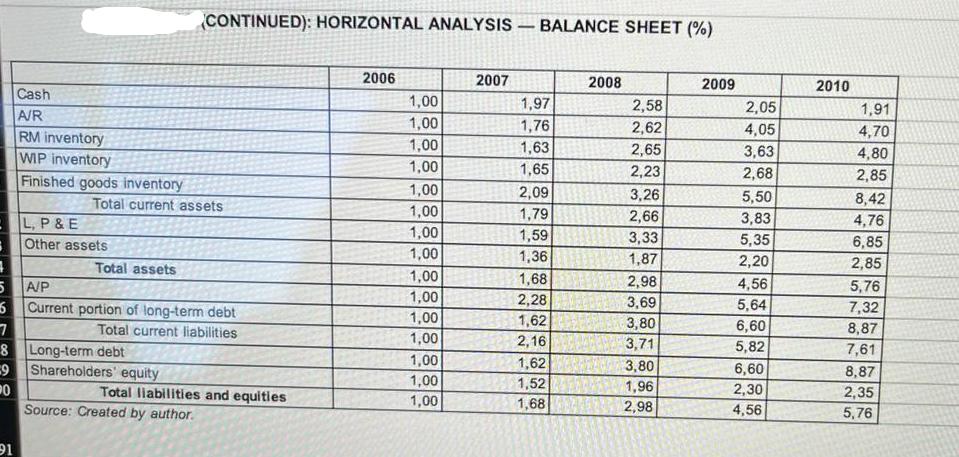
2006 2007 2008 2009 2010 Industry Average Cash A/R 3,66 4,29 3,17 1,65 1,21 16,45 22.44 23,54 19,76 19,91 18,28 8,341 RM inventory 6,16 5,98 5,48 4,90 5.13 5,38 WIP Inventory 7,98 7,81 5,97 4,68 3,94 1,54 Finished goods inventory 7,32 9,08 8,01 8,83 10,69 15,34 Total current assets 4756 50,71 42,40 39,98 39,25 47,05 L. P&E, net 50.22 47,49 56,20 58,94 59,65 45,65 Other assets 2,24 1,80 1,40 1,08 1,11 7,30 Total assets 100,00 100,00 100,00 100,00 100,00 100,00 0 A/P 16,0 21,75 19.91. 19,8 20,39 9,45 Current portion of long-term 3,64 3,52 4,65 5,28 5,61 5.39 52 debt 53 Total current liabilities 19,70 25,27 24,56 25,13 26,00 14,84 54 Long-term debt 36.45 3621 46,53 52,77 56,12 23,45 55 Shareholders' equity 43.85 39,52 28,91 22,10 17,88 61,71 Total liabilities and equities 100,00 100,00 100,00 100,00 100,00 100,00 56 Source: Created by author 57 58 EXHIBIT TN-3: HORIZONTAL ANALYSIS-INCOME STATEMENT (%) 59 2006 2007 2008 2009 2010 60 Sales 1,00 1,74 2,62 3,90 4,76 61 Cost of goods sold 1.00 1.78 2,71 4,08 5,08 62 Gross profit 1,00 1.64 2.42 3,49 4,04 63 Operating costs 64 Selling and distribution 1,00 1,48 2,28 3.27 3.64 65 Research and development 1,00 3,12 5,27 10,87 13.08 66 Administration 211 1,00 1.91 3,54 6,18 67 7.41 Depreciation 68 Operating profn 1.00 1,61 1,64 1,56 1,62 69 Interest 1.00 1,75 4,25 7.38 70 Earnings before taxes 10,27 1,00 1,59 71 Taxes 1,23 0,65 0,27 1.00 1,59 1,23 0,65 72 Net Income 0,27 1,00 73 Source: Created by author 1.59 1,23 0,65 0,27
Step by Step Solution
There are 3 Steps involved in it
Step: 1

Get Instant Access to Expert-Tailored Solutions
See step-by-step solutions with expert insights and AI powered tools for academic success
Step: 2

Step: 3

Ace Your Homework with AI
Get the answers you need in no time with our AI-driven, step-by-step assistance
Get Started


