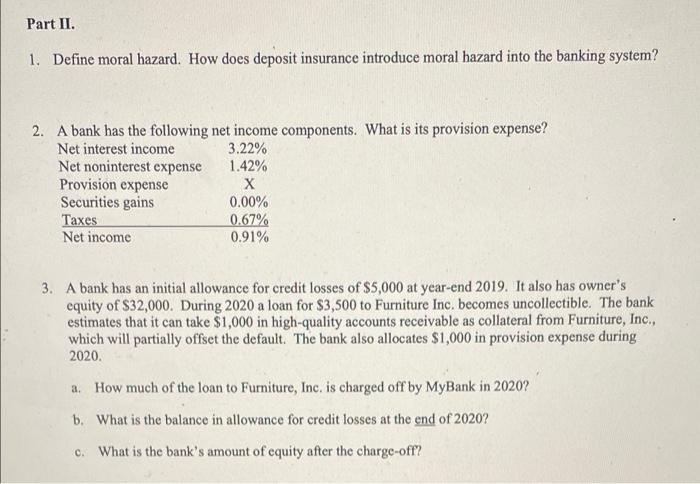
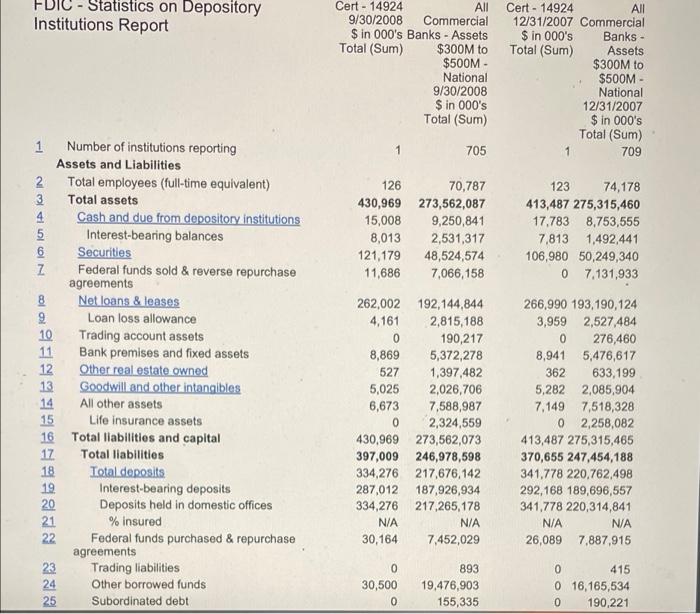
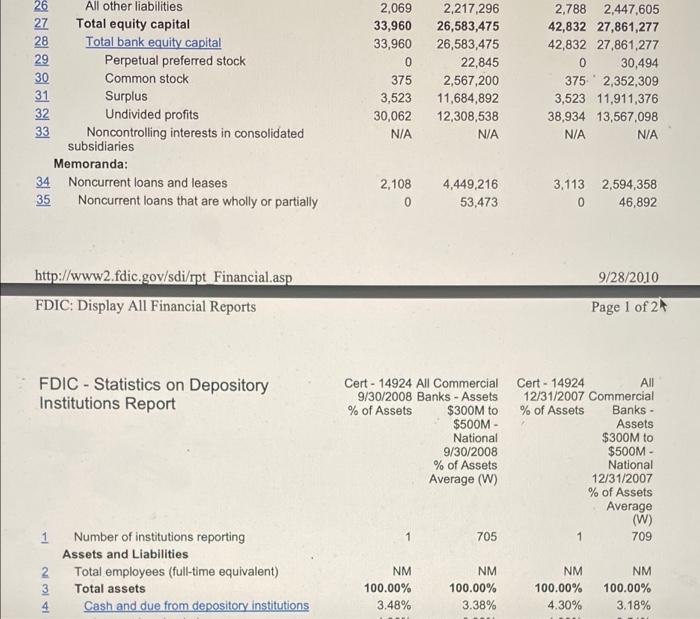
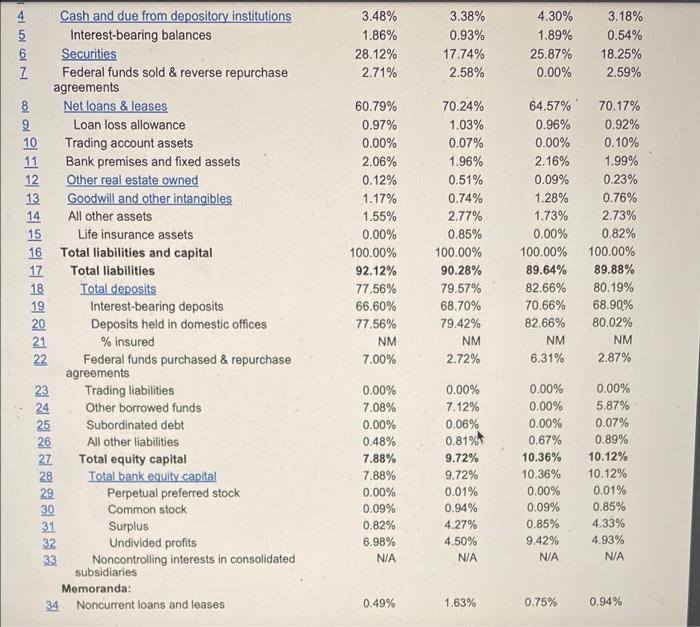
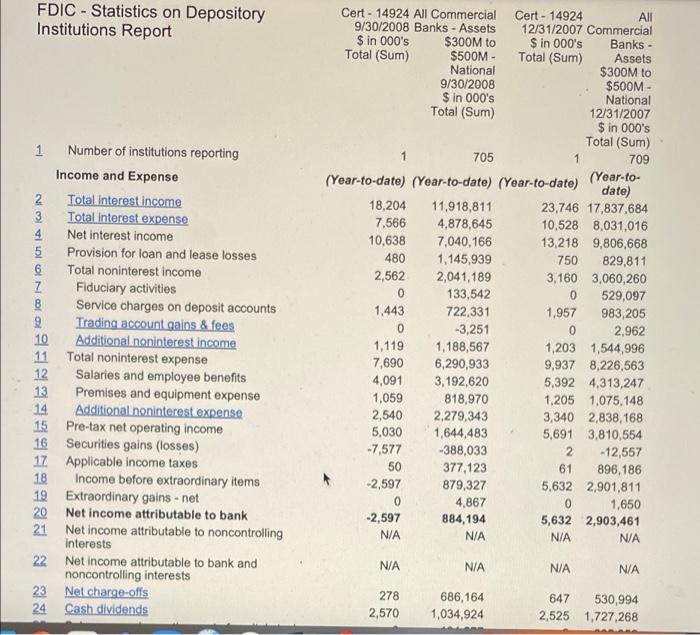
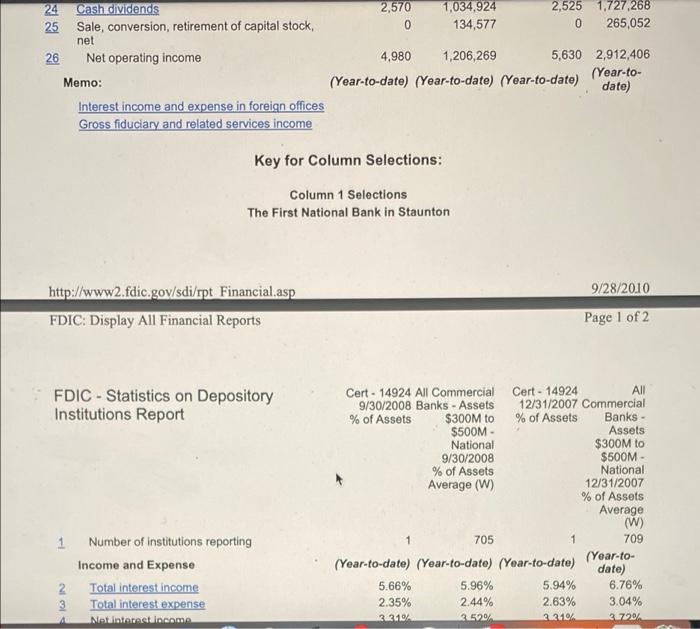
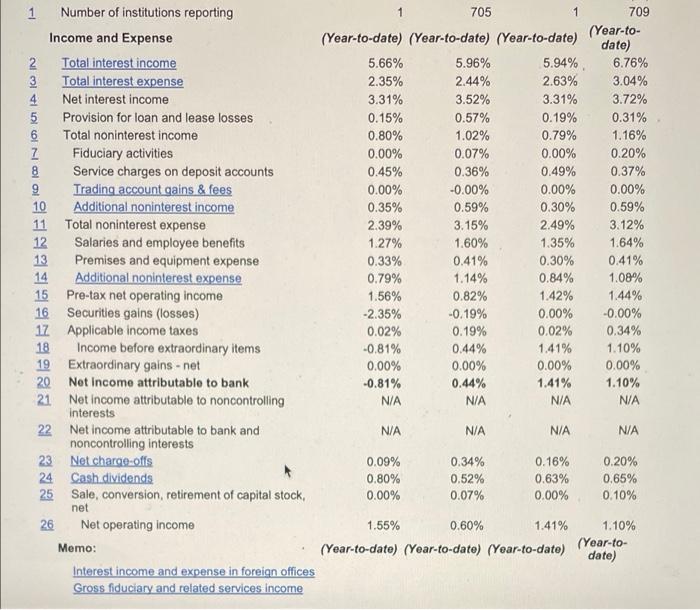
Directions: Answer the following questions based on the attached financial statements for The First National Bank in Staunton. All references to the bank" refer to Staunton Bank. 1. The bank has total assets as of September 30, 2008 totaling a. $413,487 b. $430,969 c. $430,969,000 d. $273,575,592 2. The bank's assets have increased during 2008 by about $17 million. a. True b. False 3. Thus far in 2008, cash holdings have increased sharply. a. True b. False 4. The asset growth at the bank in 2008 has come primarily from an increase in a. Goodwill and other intangibles b. Net loans and leases c. Securities and fed funds sold d. Trading account assets 5. The liability growth at the bank in 2008 has come primarily from a. fed funds purchased b. other borrowed funds c. deposits d equity capital 6. Relative to assets at peer banks, the bank holds a. far fewer loans b. far more securities c. less other real estate owned (OREO) d. all the above 7. The bank relies on total deposits relatively more than peer banks. a. True b. False As a percent of assets, the bank utilizes more federal funds sold and more federal funds purchased than peer banks a. True b. False 8. 9 Theahanlabas an equity canitelmia somewhat below peer levels 9. The bank has an equity capital ratio somewhat below peer levels. a. True b. False 10. The bank's net income during the first 3 quarters of 2008 is a. -$2,597,000 b. $5,632 c. $10,638,000 d. $896,652,000 11. The bank's return on assets (ROA) thus far in 2008 is a. 1.41% b. 0.45% c. 1.10% d. -0.81% 12. The bank's return on assets (ROA) in 2008 is well below peer banks' ROA primarily because a. its net interest incore was low relative to peer groups b. it suffered securities losses well above peer groups c. it had to set aside provision expense well above peer groups d. its net noninterest expense was much higher than peer groups 13. Net noninterest expense for the bank in 2008 was a. 0.80% b. 1.59% c. 2.39% d. -2.35% Part II. 1. Define moral hazard. How does deposit insurance introduce moral hazard into the banking system? 2. A bank has the following net income components. What is its provision expense? Net interest income 3.22% Net noninterest expense 1.42% Provision expense X Securities gains 0.00% Taxes 0.67% Net income 0.91% 3. A bank has an initial allowance for credit losses of $5,000 at year-end 2019. It also has owner's equity of S32,000. During 2020 a loan for $3,500 to Furniture Inc. becomes uncollectible. The bank estimates that it can take $1,000 in high-quality accounts receivable as collateral from Furniture, Inc., which will partially offset the default. The bank also allocates $1,000 in provision expense during 2020. a. How much of the loan to Furniture, Inc. is charged off by MyBank in 2020? b. What is the balance in allowance for credit losses at the end of 2020? c. What is the bank's amount of equity after the charge-off? FDIC - Statistics on Depository Institutions Report Cert - 14924 All 9/30/2008 Commercial $ in 000's Banks - Assets Total (Sum) $300M to $500M - National 9/30/2008 $ in 000's Total (Sum) Cert- 14924 All 12/31/2007 Commercial $ in 000's Banks - Total (Sum) Assets $300M to $500M - National 12/31/2007 $ in 000's Total (Sum) 709 1 705 NO IN IA KA IN 126 70,787 430,969 273,562,087 15,008 9,250,841 8,013 2,531,317 121,179 48,524,574 11,686 7,066,158 123 74,178 413,487 275,315,460 17.783 8,753,555 7,813 1,492,441 106,980 50,249,340 0 7,131,933 colo 1 Number of institutions reporting Assets and Liabilities 2 Total employees (full-time equivalent) 3 Total assets 4 Cash and due from depository institutions 5 Interest-bearing balances 6 Securities Z Federal funds sold & reverse repurchase agreements 8 Not loans & leases Loan loss allowance 10 Trading account assets 11 Bank premises and fixed assets 12 Other real estate owned 13 Goodwill and other intangibles 14 All other assets 15 Life insurance assets 16 Total liabilities and capital 17 Total liabilities 18 Total deposits 19 Interest-bearing deposits 20 Deposits held in domestic offices 21 % Insured 22 Federal funds purchased & repurchase agreements 23 Trading liabilities 24 Other borrowed funds 25 Subordinated debt 262,002 192,144,844 4,161 2,815,188 0 190,217 8,869 5,372,278 527 1,397,482 5,025 2,026,706 6,673 7,588,987 0 2,324,559 430,969 273,562,073 397,009 246,978,598 334,276 217,676,142 287,012 187,926,934 334,276 217,265,178 N/A N/A 30,164 7,452,029 266,990 193,190,124 3,959 2,527,484 0 276,460 8,941 5,476,617 362 633,199 5,282 2,085,904 7,149 7,518,328 0 2,258,082 413,487 275,315,465 370,655 247,454,188 341,778 220,762,498 292,168 189,696,557 341,778 220,314,841 N/A NA 26,089 7,887,915 0 30,500 0 893 19,476,903 155,335 0 415 0 16,165,534 0 190,221 26 All other liabilities 27 Total equity capital 28 Total bank equity capital 29 Perpetual preferred stock 30 Common stock 31 Surplus 32 Undivided profits 33 Noncontrolling interests in consolidated subsidiaries Memoranda: 34 Noncurrent loans and leases 35 Noncurrent loans that are wholly or partially 2,069 33,960 33,960 0 375 3,523 30,062 N/A 2.217.296 26,583,475 26,583,475 22,845 2,567,200 11,684,892 12,308,538 N/A 2,788 2.447,605 42,832 27,861,277 42,832 27,861,277 0 30,494 3752,352,309 3,523 11,911,376 38,934 13,567,098 N/A NA 2,108 0 4,449,216 53,473 3.113 2,594,358 0 46,892 9/28/2010 http://www2.fdic.gov/sdi/rpt Financial.asp FDIC: Display All Financial Reports Page 1 of 2 All FDIC - Statistics on Depository Institutions Report Cert - 14924 All Commercial Cert - 14924 9/30/2008 Banks - Assets 12/31/2007 Commercial % of Assets $300M to % of Assets Banks - $500M - Assets National $300M to 9/30/2008 $500M - % of Assets National Average (W) 12/31/2007 % of Assets Average (W) 1 705 1 709 1 | 2 3 4 Number of institutions reporting Assets and Liabilities Total employees (full-time equivalent) Total assets Cash and due from depository Institutions NM 100.00% 3.48% NM 100.00% 3.38% NM 100.00% 4.30% NM 100.00% 3.18% NOITA 3.48% 1.86% 28.12% 2.71% 3.38% 0.93% 17.74% 2.58% 4.30% 1.89% 25.87% 0.00% 3.18% 0.54% 18.25% 2.59% Cash and due from depository institutions 5 Interest-bearing balances 6 Securities Z Federal funds sold & reverse repurchase agreements 8 Net loans & leases 9 Loan loss allowance 10 Trading account assets 11 Bank premises and fixed assets 12 Other real estate owned 13 Goodwill and other intangibles 14 All other assets 15 Life insurance assets 16 Total liabilities and capital 17 Total liabilities 18 Total deposits 19 Interest-bearing deposits 20 Deposits held in domestic offices 21 % insured 22 Federal funds purchased & repurchase agreements 23 Trading liabilities 24 Other borrowed funds 25 Subordinated debt 26 All other liabilities 27 Total equity capital 28 Total bank equity capital 29 Perpetual preferred stock 30 Common stock 31 Surplus 32 Undivided profits 33 Noncontrolling interests in consolidated subsidiaries Memoranda: 34 Noncurrent loans and leases 60.79% 0.97% 0.00% 2.06% 0.12% 1.17% 1.55% 0.00% 100.00% 92.12% 77.56% 66.60% 77.56% NM 7.00% 70.24% 1.03% 0.07% 1.96% 0.51% 0.74% 2.77% 0.85% 100.00% 90.28% 79.57% 68.70% 79.42% NM 2.72% 64.57% 0.96% 0.00% 2.16% 0.09% 1.28% 1.73% 0.00% 100.00% 89.64% 82.66% 70.66% 82.66% NM 6.31% 70.17% 0.92% 0.10% 1.99% 0.23% 0.76% 2.73% 0.82% 100.00% 89.88% 80.19% 68.90% 80.02% NM 2.87% 0.00% 7.08% 0.00% 0.48% 7.88% 7.88% 0.00% 0.09% 0.82% 6.98% N/A 0.00% 7.12% 0.06% 0.81% 9.72% 9.72% 0.01% 0.94% 4.27% 4.50% NA 0.00% 0.00% 0.00% 0.67% 10.36% 10.36% 0.00% 0.09% 0.85% 9.42% N/A 0.00% 5.87% 0.07% 0.89% 10.12% 10.12% 0.01% 0.85% 4.33% 4.93% NA 0.49% 1.63% 0.75% 0.94% FDIC - Statistics on Depository Institutions Report 2 3458 791 1 Number of institutions reporting Income and Expense 2 Total interest income Total Interest expense Net interest income Provision for loan and lease losses 6 Total noninterest income Z Fiduciary activities 8 Service charges on deposit accounts Trading account gains & fees 10 Additional noninterest income 11 Total noninterest expense 12 Salaries and employee benefits 13 Premises and equipment expense 14 Additional noninterest expense 15 Pre-tax net operating income Securities gains (losses) 17 Applicable income taxes 18 Income before extraordinary items 19 Extraordinary gains -net 20 Net income attributable to bank 21 Net income attributable to noncontrolling interests 22 Net income attributable to bank and noncontrolling interests 23 Net charge-offs 24 Cash dividends Cert - 14924 All Commercial Cert - 14924 All 9/30/2008 Banks - Assets 12/31/2007 Commercial $ in 000's $300M to $ in 000's Banks - Total (Sum) $500M - Total (Sum) Assets National $300M to 9/30/2008 $500M - $ in 000's National Total (Sum) 12/31/2007 $ in 000's Total (Sum) 1 705 1 709 (Year-to-date) (Year-to-date) (Year-to-date) (Year-to- date) 18,204 11,918,811 23,746 17,837,684 7.566 4,878,645 10,528 8,031,016 10,638 7,040,166 13,218 9,806,668 480 1,145,939 750 829,811 2,562 2,041,189 3,160 3,060,260 0 133,542 0 529,097 1,443 722,331 1,957 983,205 0 -3,251 0 2,962 1,119 1,188,567 1,203 1,544,996 7,690 6,290,933 9,937 8,226,563 4,091 3,192,620 5,392 4,313,247 1,059 818,970 1,205 1,075,148 2,540 2,279,343 3,340 2,838,168 5,030 1,644,483 5,691 3.810,554 -7,577 -388,033 2 -12,557 50 377,123 61 896,186 -2,597 879,327 5,632 2,901,811 0 4,867 0 1,650 -2,597 884,194 5,632 2,903,461 N/A N/A N/A N/A N/A N/A N/A N/A 278 2,570 686,164 1,034,924 647 530,994 2,525 1,727,268 24 Cash dividends 2,570 1,034,924 2,525 1,727,268 25 Sale, conversion, retirement of capital stock, 0 134,577 0 265,052 net 26 Net operating income 4.980 1,206,269 5,630 2,912,406 (Year-to- Memo: (Year-to-date) (Year-to-date) (Year-to-date) date) Interest income and expense in foreign offices Gross fiduciary and related services income Key for Column Selections: Column 1 Selections The First National Bank in Staunton 9/28/20.10 http://www2.fdic.gov/sdi/rpt Financial.asp FDIC. Display All Financial Reports Page 1 of 2 FDIC - Statistics on Depository Institutions Report Cert - 14924 All Commercial Cert - 14924 All 9/30/2008 Banks - Assets 12/31/2007 Commercial % of Assets $300M to % of Assets Banks - $500M Assets National $300M to 9/30/2008 $500M % of Assets National Average (W) 12/31/2007 % of Assets Average (W) 705 1 709 (Year-to-date) (Year-to-date) (Year-to-date) (Year-to- date) 5.66% 5.96% 5.94% 6.76% 2.35% 2.44% 2.63% 3.04% 32194 3.520A 2.21% 27201 1 Number of institutions reporting Income and Expense Total interest income Total interest expense Noainters Income 2 3 IN IDIOD IN A 1 Number of institutions reporting 1 705 709 Income and Expense (Year-to-date) (Year-to-date) (Year-to-date) (Year-to- date) 2 Total interest income 5.66% 5.96% 5.94% 6.76% 3 Total interest expense 2.35% 2.44% 2.63% 3.04% 4 Net interest income 3.31% 3.52% 3.31% 3.72% 5 Provision for loan and lease losses 0.15% 0.57% 0.19% 0.31% 6 Total noninterest income 0.80% 1.02% 0.79% 1.16% Fiduciary activities 0.00% 0.07% 0.00% 0.20% 8 Service charges on deposit accounts 0.45% 0.36% 0.49% 0.37% 9 Trading account gains & fees 0.00% -0.00% 0.00% 0.00% 10 Additional noninterest income 0.35% 0.59% 0.30% 0.59% 11 Total noninterest expense 2.39% 3.15% 2.49% 3.12% 12 Salaries and employee benefits 1.27% 1.60% 1.35% 1.64% 13 Premises and equipment expense 0.33% 0.41% 0.30% 0.41% 14 Additional noninterest expense 0.79% 1.14% 0.84% 1.08% 15 Pre-tax net operating income 1.56% 0.82% 1.42% 1.44% 16 Securities gains (losses) -2.35% -0.19% 0.00% -0.00% 17 Applicable income taxes 0.02% 0.19% 0.02% 0.34% 18 Income before extraordinary items -0.81% 0.44% 1.41% 1.10% 19 Extraordinary gains.net 0.00% 0.00% 0.00% 0.00% 20 Net Income attributable to bank -0.81% 0.44% 1.41% 1.10% 21 Net income attributable to noncontrolling N/A N/A N/A N/A interests 22 Net income attributable to bank and N/A N/A N/A N/A noncontrolling interests 23 Net chargo-offs 0.09% 0.34% 0.16% 0.20% 24 Cash dividends 0.80% 0.52% 0.63% 0.65% 25 Sale, conversion, retirement of capital stock, 0.00% 0.07% 0.00% 0.10% net 26 Net operating income 1.55% 0.60% 1.41% 1.10% Memo: (Year-to-date) (Year-to-date) (Year-to-date) (Year-to- date) Interest income and expense in foreign offices Gross fiduciary and related services Income
