Answered step by step
Verified Expert Solution
Question
1 Approved Answer
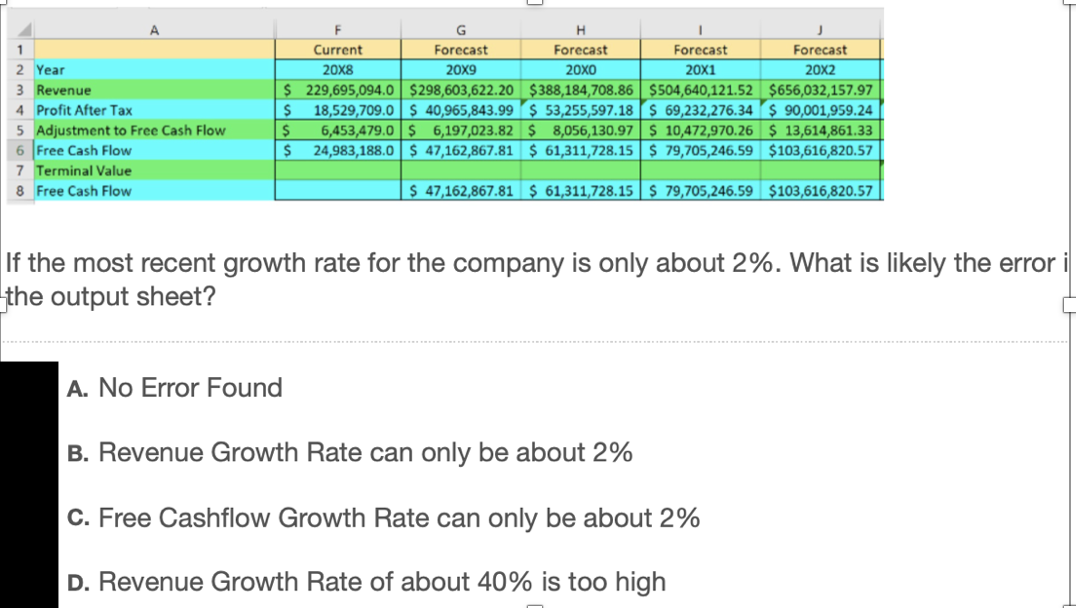
Discounted Cash Flow A 1 2 Year 3 Revenue 4 Profit After Tax 5 Adjustment to Free Cash Flow 6 Free Cash Flow 7 Terminal

Discounted Cash Flow
A 1 2 Year 3 Revenue 4 Profit After Tax 5 Adjustment to Free Cash Flow 6 Free Cash Flow 7 Terminal Value 8 Free Cash Flow G H Current Forecast Forecast Forecast Forecast 20x8 20x9 20x0 20x1 20X2 $ 229,695,094.0 $298,603,622.20 $388,184,708.86 $504,640,121.52 $656,032,157.97 $ 18,529,709.0 $ 40,965,843.99 $ 53,255,597.18 $ 69,232,276.34 $ 90,001,959.24 $ 6,453,479.0 $ 6,197,023.82 $ 8,056,130.97$ 10,472,970.26 $ 13,614,861.33 $ 24,983,188.0 $ 47,162,867.81 $ 61,311,728.15$ 79,705,246.59 $103,616,820.57 $ 47,162,867.81 $ 61,311,728.15$ 79,705,246.59 $103,616,820.57 If the most recent growth rate for the company is only about 2%. What is likely the error i the output sheet? A. No Error Found B. Revenue Growth Rate can only be about 2% C. Free Cashflow Growth Rate can only be about 2% D. Revenue Growth Rate of about 40% is too highStep by Step Solution
There are 3 Steps involved in it
Step: 1

Get Instant Access to Expert-Tailored Solutions
See step-by-step solutions with expert insights and AI powered tools for academic success
Step: 2

Step: 3

Ace Your Homework with AI
Get the answers you need in no time with our AI-driven, step-by-step assistance
Get Started


