Discuss the horizontal analysis in the table below, explaining why Cash and Cash equivalents have been twice in 2018 than 2017 despite cash from Operating Activities falling by almost one third. And what risks for doing that?
Horizontal Analysis of Cash Flows
| | Note | 2018 | 2017 | |
| Cash flows from operating activities | | m | m | % change |
| Cash generated from operations | 32 | 137.5 | 200.4 | (31.4) |
| Finance income | | 0.1 | 0.1 | |
| Finance costs | | (11.1) | (11.2) | (0.9) |
| Tax received/(paid) | | 1.3 | (16.3) | (108) |
| Net cash generated from operating activities | | 127.8 | 173.0 | (26.1) |
| | | | | |
| Cash flows from investing activities | | | | |
| Purchase of property, plant and equipment | | (105.3) | (72.6) | 45.0 |
| Purchase of intangible assets | | (30.7) | (52.2) | (41.2) |
| Proceeds from the sale of property, plant and equipment | | 7.1 | | |
| Investment in associate | | (7.5) | | |
| Net cash used in investing activities | | (136.4) | (124.8) | 9.3 |
| | | | | |
| Cash flows from financing activities | | | | |
| Drawdown/(repayment) of revolving credit facility | 22 | 66.0 | (25.0) | (364.0) |
| Dividends paid | 12 | (35.6) | (42.0) | (15.2) |
| Purchase of shares by Debenhams Retail Employment Trust 2004 | 29 | | (0.8) | (100) |
| Finance lease payments | | (1.6) | (1.6) | |
| Debt amendment costs | | (0.8) | | |
| Net cash generated from/(used in) financing activities | | 28.0 | (69.4) | (140.3) |
| | | | | |
| Net increase/(decrease) in cash and cash equivalents | 19.4 | (21.2) | (191.5) |
| Net cash and cash equivalents at beginning of financial year | | 19.7 | 40.8 | (51.7) |
| Foreign exchange (losses)/gains on cash and cash equivalents | | (0.2) | 0.1 | (300) |
| Net cash and cash equivalents at end of financial year | 33 | 38.9 | 19.7 | 97.5 |
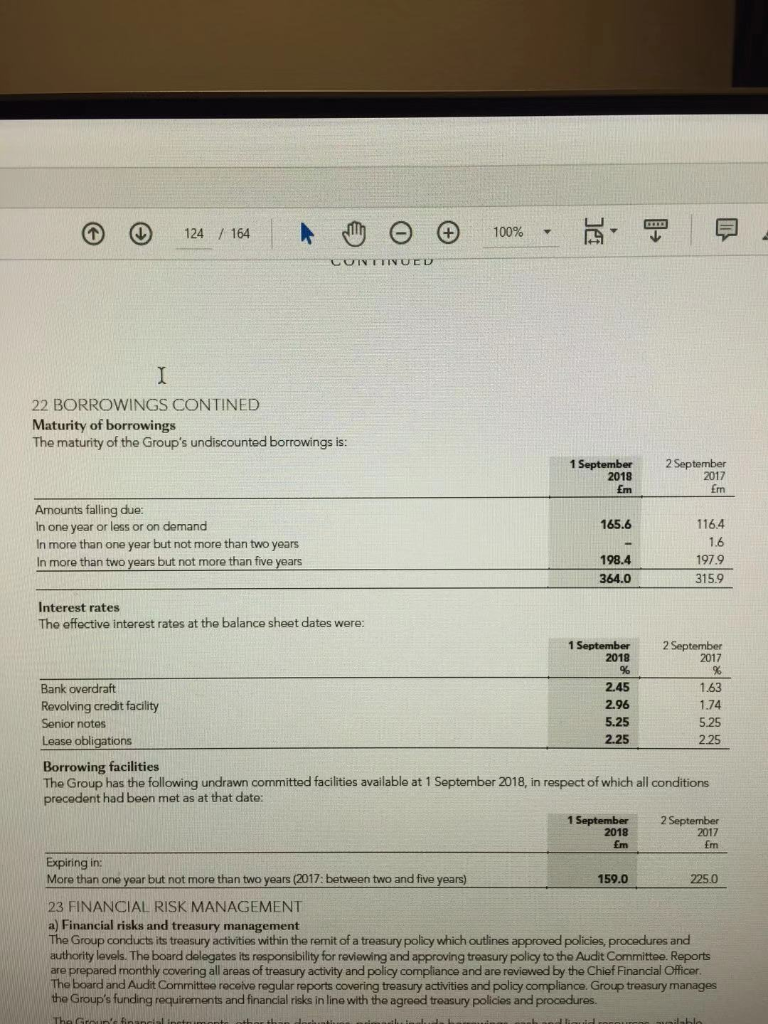
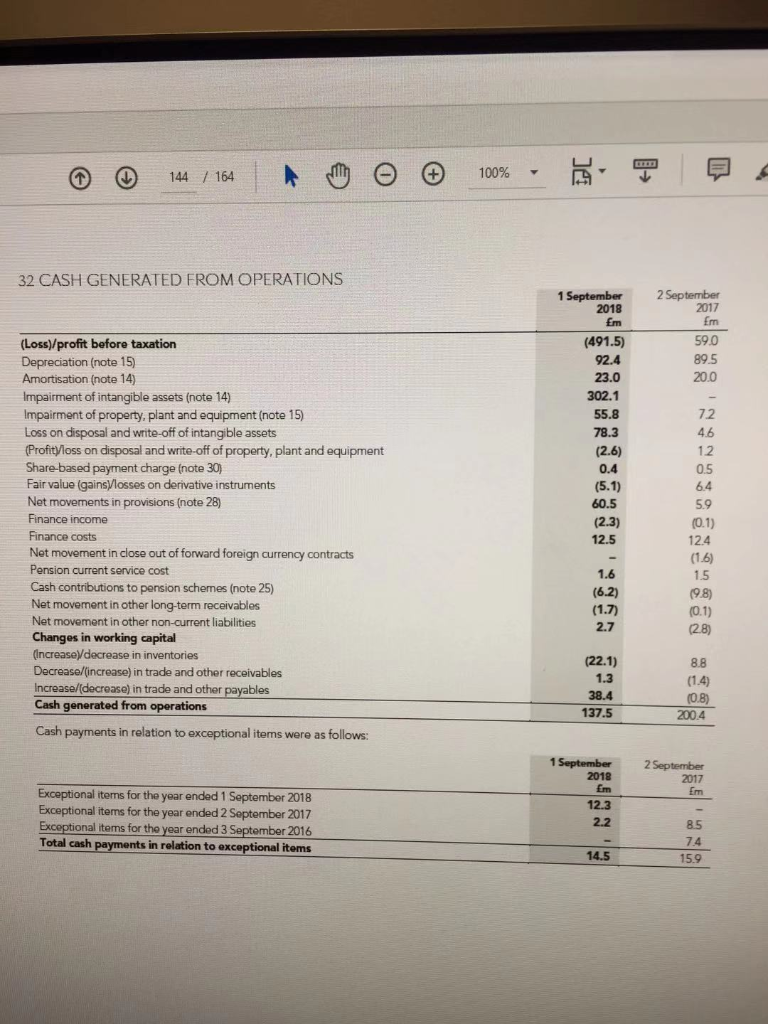
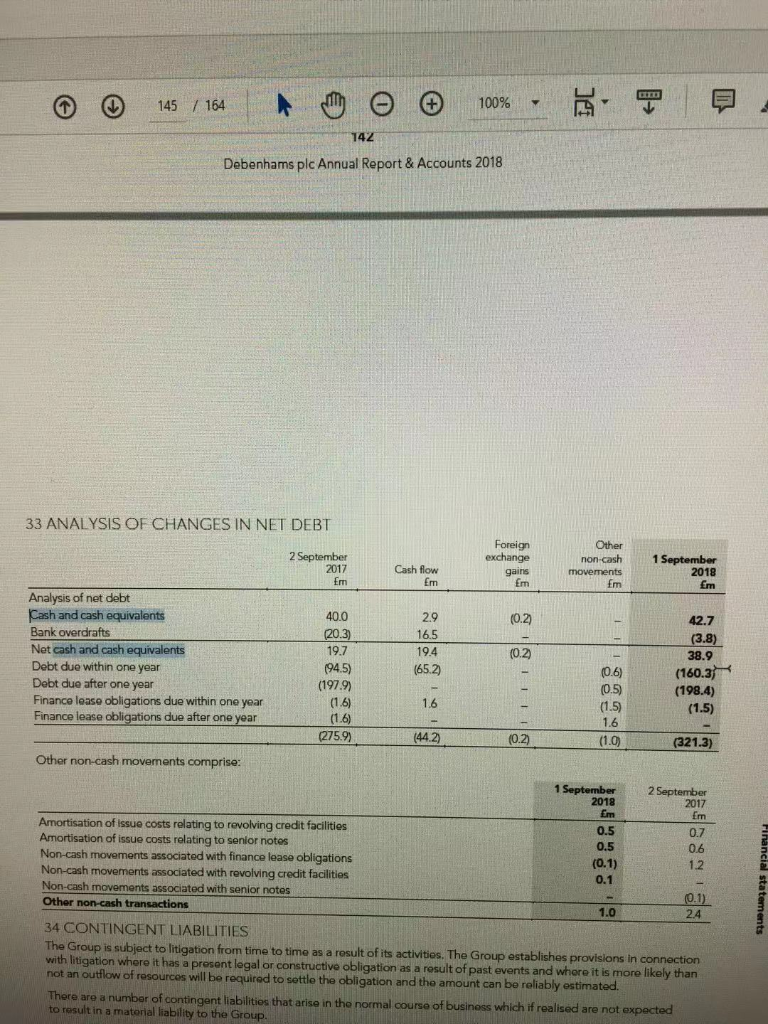
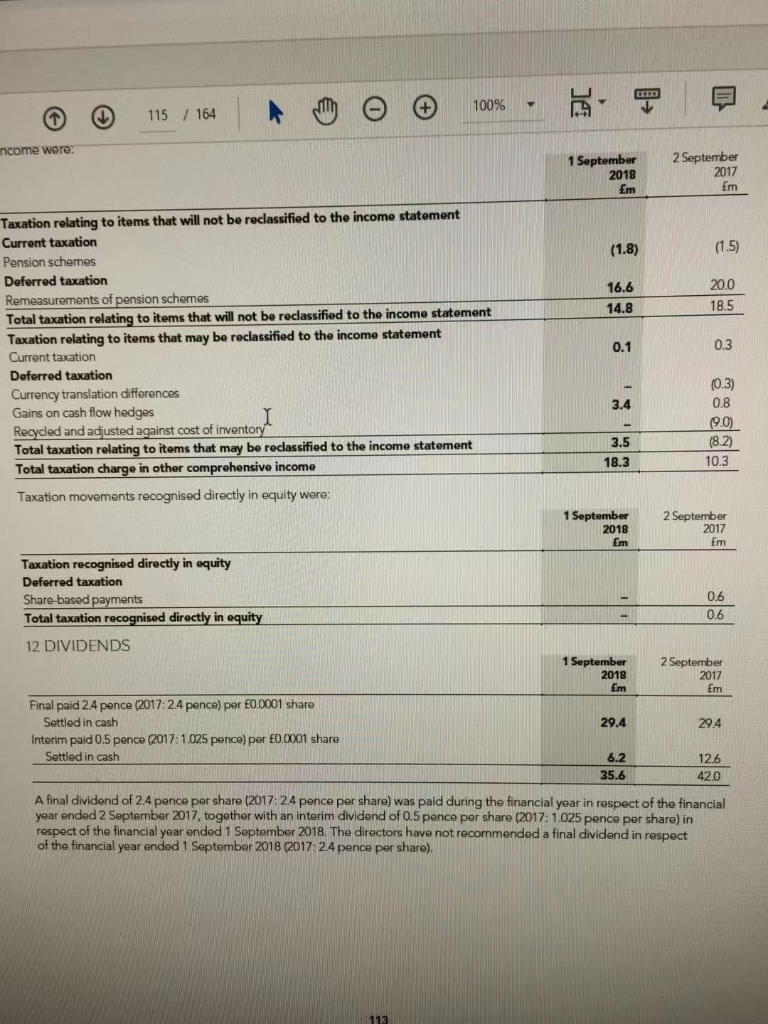
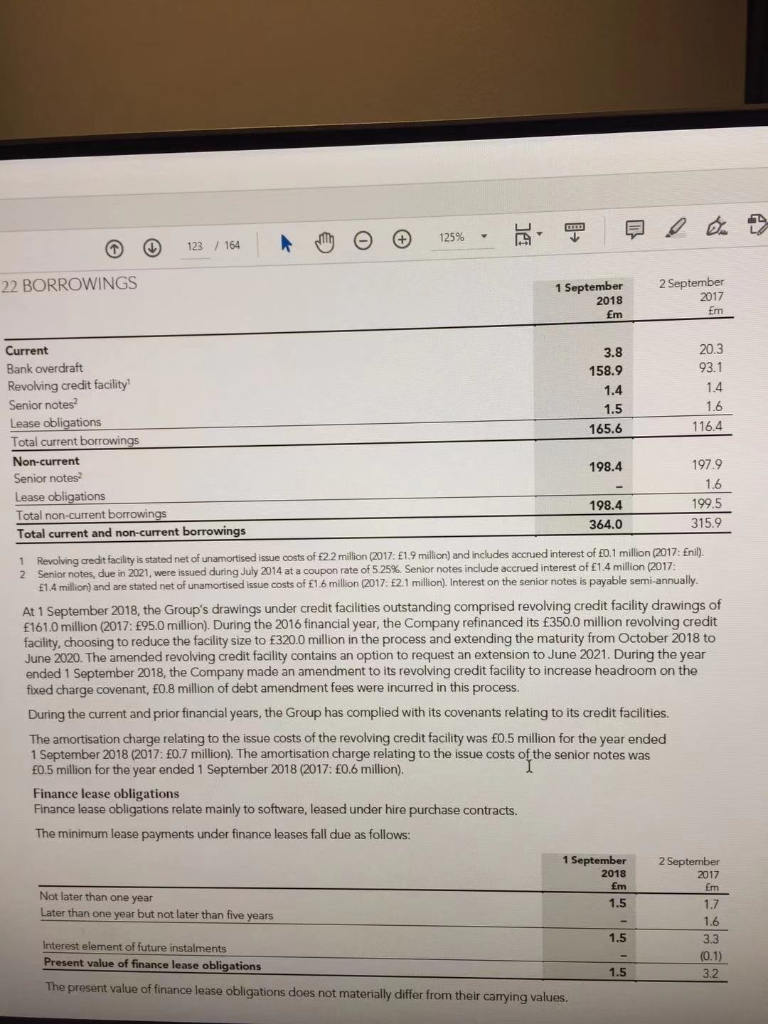
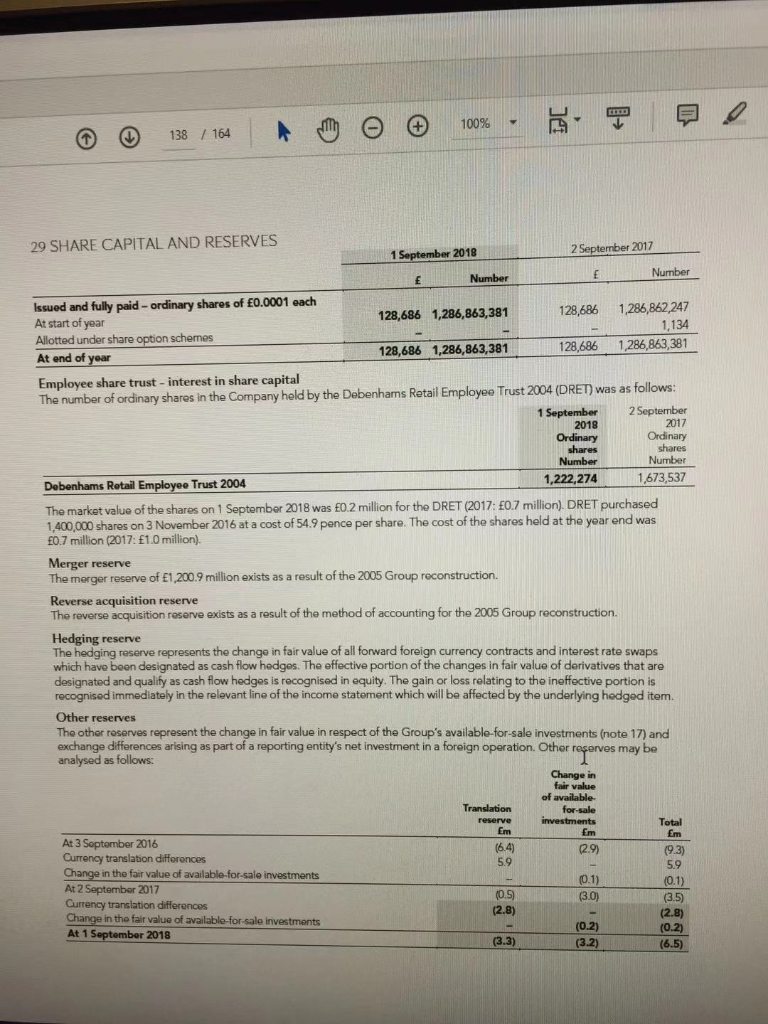
124 / 164 A m o 100% - 7 9 CUTTINUEU 22 BORROWINGS CONTINED Maturity of borrowings The maturity of the Group's undiscounted borrowings is: 1 September 2018 2 September 2017 Em Em 165.6 116.4 Amounts falling due: In one year or less or on demand In more than one year but not more than two years In more than two years but not more than five years 1.6 197.9 198.4 364.0 315.9 Interest rates The effective interest rates at the balance sheet dates were: 1 September 2018 2 September 2017 Bank overdraft 2.45 1.63 Revolving credit facility 2.96 1.74 Senior notes 5.25 5.25 Lease obligations 2.25 2.25 Borrowing facilities The Group has the following undrawn committed facilities available at 1 September 2018, in respect of which all conditions precedent had been met as at that date: 1 September 2 September 2018 2017 fm Em Expiring in: More than one year but not more than two years (2017: between two and five years) 159.0 225.0 23 FINANCIAL RISK MANAGEMENT a) Financial risks and treasury management The Group conducts its treasury activities within the remit of a treasury policy which outlines approved policies, procedures and authority levels. The board delegates its responsibility for reviewing and approving treasury policy to the Audit Committee. Reports are prepared monthly covering all areas of treasury activity and policy compliance and are reviewed by the Chief Financial Officer The board and Audit Committee receive regular reports covering treasury activities and policy compliance. Group treasury manages the Group's funding requirements and financial risks in line with the agreed treasury policies and procedures The Group's financial inetrimento ether the de l icid i lable 144 / 164 A 100% - 32 CASH GENERATED FROM OPERATIONS 2 September 2017 Em 59.0 (Loss)/profit before taxation Depreciation (note 15) Amortisation (note 14) Impairment of intangible assets (note 14) Impairment of property, plant and equipment (note 15) Loss on disposal and write-off of intangible assets (Profit loss on disposal and write-off of property, plant and equipment Share-based payment charge (note 30) Fair value (gainsvlosses on derivative instruments Net movements in provisions (note 28) Finance income Finance costs Net movement in close out of forward foreign currency contracts Pension current service cost Cash contributions to pension schemes (note 25) Net movement in other long-term receivables Net movement in other non-current liabilities Changes in working capital (Increase decrease in inventories Decrease/(increase) in trade and other receivables Increase/(decrease) in trade and other payables Cash generated from operations 1 September 2018 Em (491.5) 92.4 23.0 302.1 55.8 78.3 (2.6) 0.4 (5.1) 60.5 (2.3) 12.5 (0.1) 124 (1.6) 1.5 (9,8) (0.1) (28) (1.7) 2.7 8.8 (22.1) 1.3 38.4 137.5 (1.4) (0.8) 2004 Cash payments in relation to exceptional items were as follows: 1 September 2018 2 September 2017 Em Exceptional items for the year ended 1 September 2018 Exceptional items for the year ended 2 September 2017 Exceptional items for the year ended 3 September 2016 Total cash payments in relation to exceptional items 12.3 2.2 14.5 00** *0,00 -.* 145 / 164 A m o 100% 9 142 Debenhams plc Annual Report & Accounts 2018 2017 (65.2 (160.3) (44.2 33 ANALYSIS OF CHANGES IN NET DEBT Foreign Other 2 September exchange non-cash 1 September Cash flow gains movements 2018 Em Em Em Em Analysis of net debt Cash and cash equivalents 40.0 2.9 (0.2 42.7 Bank overdrafts (20.3) 16.5 (3.8) Net cash and cash equivalents 19.7 19.4 38.9 Debt due within one year (94.5) (0.6) Debt due after one year (197.9) (0.5) (198.4) Finance lease obligations due within one year (1.6) (1.5) (1.5) Finance lease obligations due after one year 11.6 1.6 (275.9) (1.0 (321.3) Other non-cash movements comprise: 1 September 2 September 2018 2017 Em Amortisation of issue costs relating to revolving credit facilities 0.5 Amortisation of issue costs relating to senior notes 0.5 Non-cash movements associated with finance lease obligations (0.1) Non-cash movements associated with revolving credit facilities Non-cash movements associated with senior notes Other non-cash transactions 34 CONTINGENT LIABILITIES The Group is subject to litigation from time to time as a result of its activities. The Group establishes provisions in connection with litigation where it has a prosent legal or constructive obligation as a result of past events and where it is more likely than not an outflow of resources will be required to settle the obligation and the amount can be reliably estimated. There are a number of contingent liabilities that arise in the normal course of business which if realised are not expected to result in a material liability to the Group Em Financial statements 115 / 164 cm 0 100% ncome were: 1 September 2018 2 September 2017 (1.8) (1.5) 16.6 20.0 18.5 14.8 0.1 0.3 Taxation relating to items that will not be reclassified to the income statement Current taxation Pension schemes Deferred taxation Remeasurements of pension schemes Total taxation relating to items that will not be reclassified to the income statement Taxation relating to items that may be reclassified to the income statement Current taxation Deferred taxation Currency translation differences Gains on cash flow hedges Recycled and adjusted against cost of inventory Total taxation relating to items that may be reclassified to the income statement Total taxation charge in other comprehensive income Taxation movements recognised directly in equity were: 3.5 18.3 1 September 2018 Em 2 September 2017 Em Taxation recognised directly in equity Deferred taxation Share-based payments Total taxation recognised directly in equity 12 DIVIDENDS 0.6 1 September 2018 Em 2 September 2017 Em Final paid 24 pence (2017: 2.4 pence) per 0.0001 share Settled in cash Interim paid 0.5 pence (2017: 1.025 pence) per 0.0001 share Settled in cash 29.4 29.4 6.2 35.6 12.6 420 A final dividend of 2.4 pence per share (2017: 24 ponce per share) was paid during the financial year in respect of the financial year ended 2 September 2017, together with an interim dividend of 0.5 ponce per share (2017: 1.025 pence per share) in respect of the financial year ended 1 September 2018. The directors have not recommended a final dividend in respect of the financial year onded 1 September 2018 (2017:24 pence per share). 113 123 / 184 Auto o 125% - l e 7 O 22 BORROWINGS 1 September 2018 Em 2 September 2017 fm 3.8 158.9 20.3 93.1 1.4 1.4 1.6 1.5 165.6 116.4 Current Bank overdraft Revolving credit facility Senior notes Lease obligations Total current borrowings Non-current Senior notes Lease obligations Total non-current borrowings Total current and non-current borrowings 198.4 197.9 1.6 199.5 315.9 198.4 364.0 1 2 Revolving credit facility is stated net of unamortised issue costs of f2.2 million (2017: 1.9 million) and includes accrued interest of 0.1 million (2017: Enil). Senior notes, due in 2021, were issued during July 2014 at a coupon rate of 5.25% Senior notes include accrued interest of 1.4 million (2017: 1.4 million) and are stated net of unamortised issue costs of 1.6 million (2017: 2.1 million). Interest on the senior notes is payable semi-annually. At 1 September 2018, the Group's drawings under credit facilities outstanding comprised revolving credit facility drawings of 161.0 million (2017: 95.0 million). During the 2016 financial year, the Company refinanced its 350.0 million revolving credit facility, choosing to reduce the facility size to f320.0 million in the process and extending the maturity from October 2018 to June 2020. The amended revolving credit facility contains an option to request an extension to June 2021. During the year ended 1 September 2018, the Company made an amendment to its revolving credit facility to increase headroom on the fixed charge covenant, 0.8 million of debt amendment fees were incurred in this process. During the current and prior financial years, the Group has complied with its covenants relating to its credit facilities. The amortisation charge relating to the issue costs of the revolving credit facility was 0.5 million for the year ended 1 September 2018 (2017: 0.7 million). The amortisation charge relating to the issue costs of the senior notes was 0.5 million for the year ended 1 September 2018 (2017: 0.6 million). Finance lease obligations Finance lease obligations relate mainly to software, leased under hire purchase contracts. The minimum lease payments under finance leases fall due as follows: 2 September 2017 1 September 2018 Em 1.5 Not later than one year Later than one year but not later than five years 1.7 3.3 Interest element of future instalments Present value of finance lease obligations (0.1) .2 5 1. 3 The present value of finance lease obligations does not materially differ from their carrying values. 138 164 A ? 100% - ? 29 SHARE CAPITAL AND RESERVES 1 September 2018 2 September 2017 Number Number Issued and fully paid-ordinary shares of 0.0001 each 128,686 1,286,863,381 128,686 1,286,862,247 At start of year 1,134 Allotted under share option schemes 128,686 1,286,863,381 128,686 1,286,863, 381 At end of year Employee share trust - interest in share capital The number of ordinary shares in the Company held by the Debenhams Retail Employee Trust 2004 (DRET) was as follows: 1 September 2 September 2018 2017 Ordinary Ordinary shares shares Number Number Debenhams Retail Employee Trust 2004 1,222,274 1,673,537 The market value of the shares on 1 September 2018 was 0.2 million for the DRET (2017: 0.7 million). DRET purchased 1,400,000 shares on 3 November 2016 at a cost of 54.9 pence per share. The cost of the shares held at the year end was 0.7 million (2017: 10 million). Merger reserve The merger reserve of 1,200.9 million exists as a result of the 2005 Group reconstruction. Reverse acquisition reserve The reverse acquisition reserve exists as a result of the method of accounting for the 2005 Group reconstruction Hedging reserve The hedging reserve represents the change in fair value of all forward foreign currency contracts and interest rate swaps which have been designated as cash flow hedges. The effective portion of the changes in fair value of derivatives that are designated and qualify as cash flow hedges is recognised in equity. The gain or loss relating to the ineffective portion is recognised immediately in the relevant line of the income statement which will be affected by the underlying hedged item. Other reserves The other reserves represent the change in fair value in respect of the Group's available for sale investments (note 17) and exchange differences arising as part of a reporting entity's net investment in a foreign operation Other reporvos may be analysed as follows: Change in fair value Translation reserve of available for sale investments fm Total Em (6.4) 5.9 2.99 At 3 September 2016 Currency translation differences Change in the fair value of available for sale investments At 2 September 2017 Currency translation differences Change in the fair value of available for sale investments At 1 September 2018 (0.5) (2.8) (3.3)