

Answered step by step
Verified Expert Solution
Question
1 Approved Answer
Discuss your findings. This should include: A discussion of the main statistics, such as the expected return for each stock, the standard deviation for each
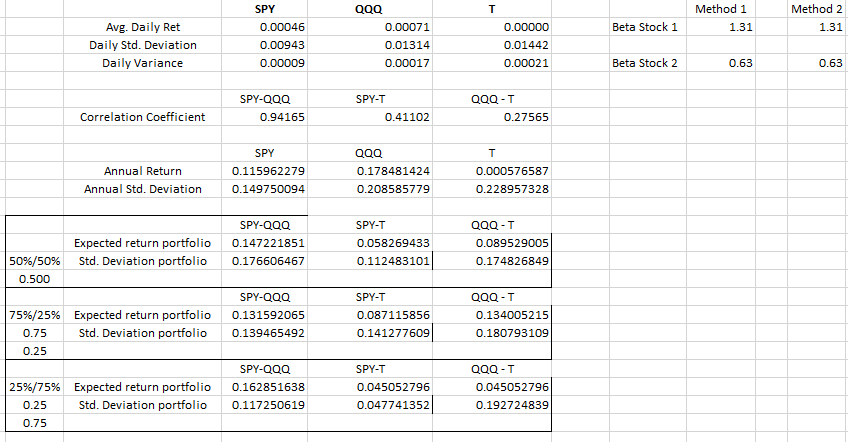
Discuss your findings. This should include:
- A discussion of the main statistics, such as
- the expected return for each stock,
- the standard deviation for each stock, the expected return of the portfolio of the two stocks you selected using the various percentages allocated to each (50%-50%, 75%-25%, 25%-75%) provided in the sheet,
- the standard deviation for each portfolio of the two stocks you selected using the various percentages allocated to each (50%-50%, 75%-25%, 25%-75%),
- the beta of each stock,
- the beta of a portfolio of the two stocks using the percentages allocated to each (50%-50%, 75%-25%, 25%-75%).
- Be sure to discuss some of the key concepts too (e.g., point out the standard deviation of the portfolio is less than the weighted average of the standard deviations of the stocks in the portfolio)
Step by Step Solution
There are 3 Steps involved in it
Step: 1

Get Instant Access to Expert-Tailored Solutions
See step-by-step solutions with expert insights and AI powered tools for academic success
Step: 2

Step: 3
Ace Your Homework with AI
Get the answers you need in no time with our AI-driven, step-by-step assistance
Get Started
How To Find And Invest In Off Market Homes
Authors: Akanej H. Yamamoto
1st Edition
979-8860383876