Display all the leading measures like - the number of claims, the amount claimed, amount claimed on the property, and the amount claimed on the

Display all the leading measures like - the number of claims, the amount claimed, amount claimed on the property, and the amount claimed on the vehicle.
2. Identify the correlation between the age of the customer and the total amount claimed by them. Is there any trend or pattern in the values?
3. Show location-wise incident counts across a geo-map
4. Have a dashboard representing the following information:
- Gender-wise incidents and claims
- The number of claims by Incident Severity
- The number of claims by Incident Types
- The number of claims based on auto_year (use binning concept)
- The number of claims by auto_make
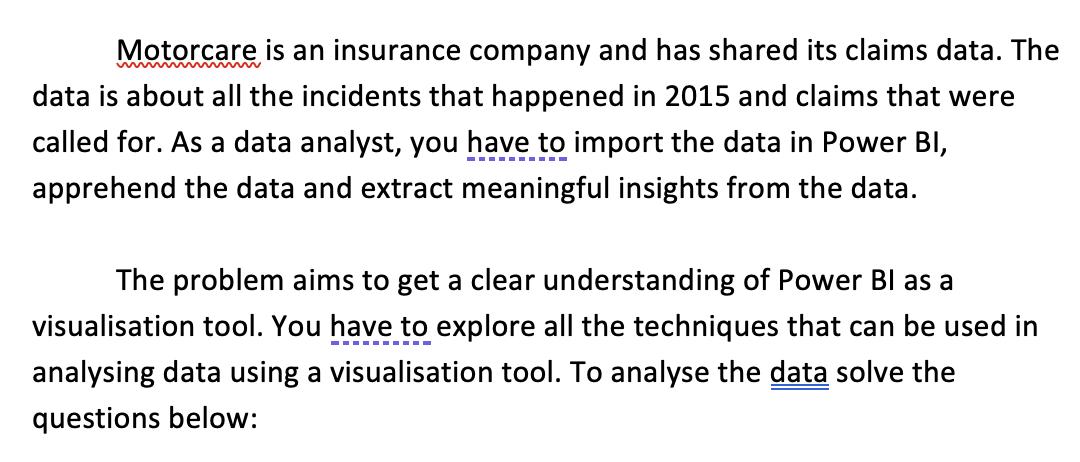
Motorcare is an insurance company and has shared its claims data. The data is about all the incidents that happened in 2015 and claims that were called for. As a data analyst, you have to import the data in Power BI, apprehend the data and extract meaningful insights from the data. The problem aims to get a clear understanding of Power BI as a visualisation tool. You have to explore all the techniques that can be used in analysing data using a visualisation tool. To analyse the data solve the questions below:
Step by Step Solution
3.37 Rating (144 Votes )
There are 3 Steps involved in it
Step: 1
Here are the steps to analyze the Motorcare insurance claims data in Power BI 1 To display leading ...
See step-by-step solutions with expert insights and AI powered tools for academic success
Step: 2

Step: 3

Ace Your Homework with AI
Get the answers you need in no time with our AI-driven, step-by-step assistance
Get Started


