D'Leon Inc. Integrated Case Part II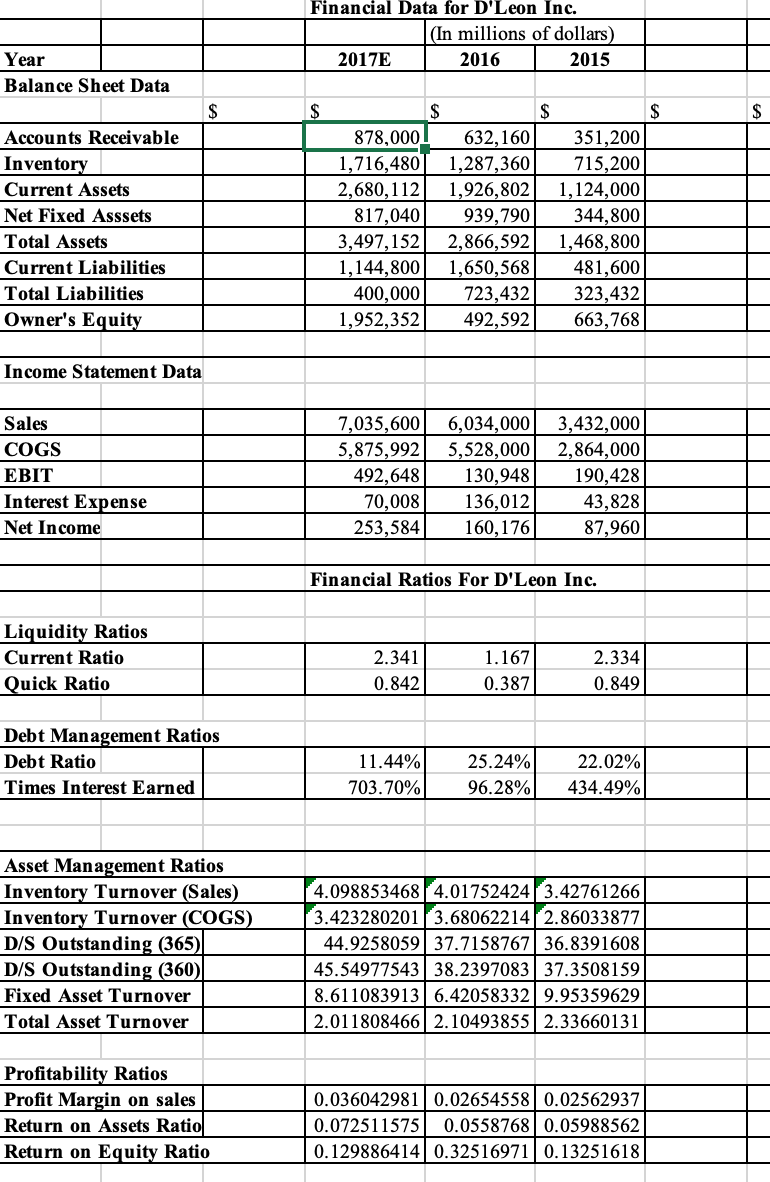
-
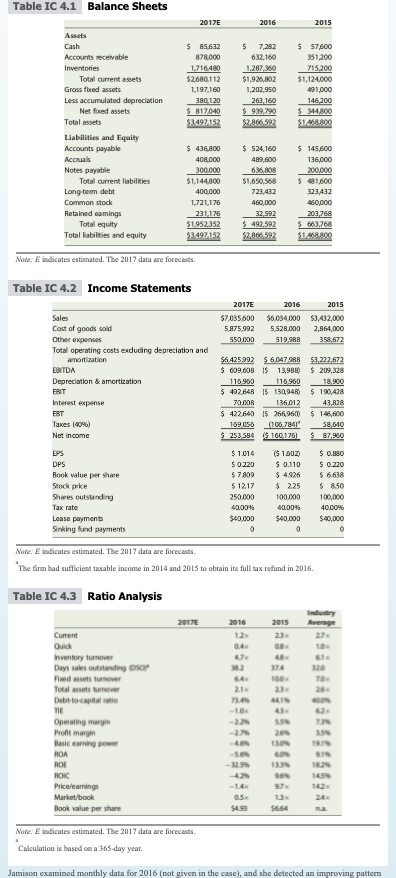
Use the DuPont equation to provide a summary and overview of DLeons financial condition as projected for 2017. What are the firms major strengths and weaknesses?
Financial Data for D'Leon Inc. (In millions of dollars) 2017E 2016 2015 Year Balance Sheet Data $ $ Accounts Receivable Inventory Current Assets Net Fixed Asssets Total Assets Current Liabilities Total Liabilities Owner's Equity $ 878,000 632,160 1,716,480 1,287,360 2,680,112 1,926,802 817,040 939,790 3,497,152 2,866,592 1,144,800 1,650,568 400,000 723,432 1,952,352 492,592 $ $ 351,200 715,200 1,124,000 344,800 1,468,800 481,600 323,432 663,768 Income Statement Data Sales COGS EBIT Interest Expense Net Income 7,035,600 5,875,992 492,648 70,008 253,584 6,034,000 5,528,000 130,948 136,012 160,176 3,432,000 2,864,000 190,428 43,828 87,960 Financial Ratios For D'Leon Inc. Liquidity Ratios Current Ratio Quick Ratio 2.341 0.842 1.167 0.387 2.334 0.849 Debt Management Ratios Debt Ratio Times Interest Earned 11.44% 703.70% 25.24% 96.28% 22.02% 434.49% Asset Management Ratios Inventory Turnover (Sales) Inventory Turnover (COGS) D/S Outstanding (365) D/S Outstanding (360) Fixed Asset Turnover Total Asset Turnover 4.098853468 4.017524243.42761266 3.423280201 3.68062214 2.86033877 44.9258059 37.7158767 36.8391608 45.54977543 38.2397083 37.3508159 8.611083913 6.42058332 9.95359629 2.011808466 2.10493855 2.33660131 Profitability Ratios Profit Margin on sales Return on Assets Ratio Return on Equity Ratio 0.036042981 0.02654558 0.02562937 0.072511575 0.0558768 0.05988562 0.1298864140.32516971 0.13251618 Table IC 4.1 Balance Sheets 2017E 2016 2015 $ 85.632 878.000 1716480 $2,680,112 1,197,160 380120 $ 817040 $3497152 $ 7,282 632,160 1,287,360 $1,926,802 1,202,950 263.160 $ 92.190 $2,866592 $ 57,600 351,200 715,200 $1,124.000 491,000 146.200 $ 314,800 $1.00 Assets Cash Accounts receivable Inventories Total current assets Gross feed assets Less accumulated depreciation Net foed assets Total assets Liabilities and Equity Accounts payable Accruals Notes payable Total current liabilities Long tem debt Common stock Retained eamings Total equity Total liabilities and equity $ 145,600 136.000 200.000 $ 436,800 408,000 300,000 $1,144.800 400.000 1721,176 231175 $1.952352 $3497152 $ 524,160 489,600 636,808 $1,650,568 723,432 460,000 32,592 $ 492,592 323432 460,000 203 760 5 663,768 Note: E indicates estimated. The 2017 data are forecasts. Table IC 4.2 Income Statements 2017E $7,035,600 5,875,992 550.000 2016 2015 $6,034.000 $3,432,000 5.52.000 2,864,000 519.0RR 354,672 Sales Cost of goods sold Other expenses Total operating costs exduding depreciation and amortization EBITDA Depreciation & amortization FRIT Interest expense EST Taxes (90%) Net Income $6,425992 $ 6.047.968 $3,222,672 $ 609,000 IS 13,989 $ 209,328 116980 116,900 18.900 $ 402 648 1$ 139940 $ 190,428 70.000 136.012 43,028 $ 422 640 15 266,9600 $ 146,600 109050 (106,7841" 58,640 $ 253594 $ 160,176) $ ZO $ 1.014 $ 1 BOZ $ 0.880 $ 0.220 $ 0.110 $ 0.220 5 7100 $ 4.926 $ 6.638 $12.17 $ 2.25 $ 8.50 250,000 100.000 100,000 40.00% 40.00% 40.00% $40,000 $40,000 $40,000 0 0 DPS Book value per share Stock prke Share outstanding Tax rate Lease payments Sinking fund payments Note: indicates estimated. The 2017 data are forecasts. The firm had sufficient taxable income in 2014 and 2015 to obtain its full tax refund in 2016. Table IC 4.3 Ratio Analysis 2017 2015 Industry Average 2016 12 374 100 Current Quick Inventory turnover Days sales outstanding or Fedts turnover Totalsts tumover Debt-to-capital ratio THE Operating margin Profit margin Basic earning power ROA ROE ROIC Price/earnings Market/book Book value per share -32.5% 13:35 145 OSX 5493 $6.54 Note: indicates estimated. The 2017 data are forecasts. Calculation is based on a 165-day year Jamison examined monthly data for 2016 (not given in the case), and she detected an improving pattern