

Answered step by step
Verified Expert Solution
Question
1 Approved Answer
Do a comprehensive CAGR Analysis for each year. 2017 2016 2015 2014 2013 FOR THE YEAR Net sales $20,252.4 $16,208.1 $16,439.3 $21,105.1 $19,052.0 Costs, expenses
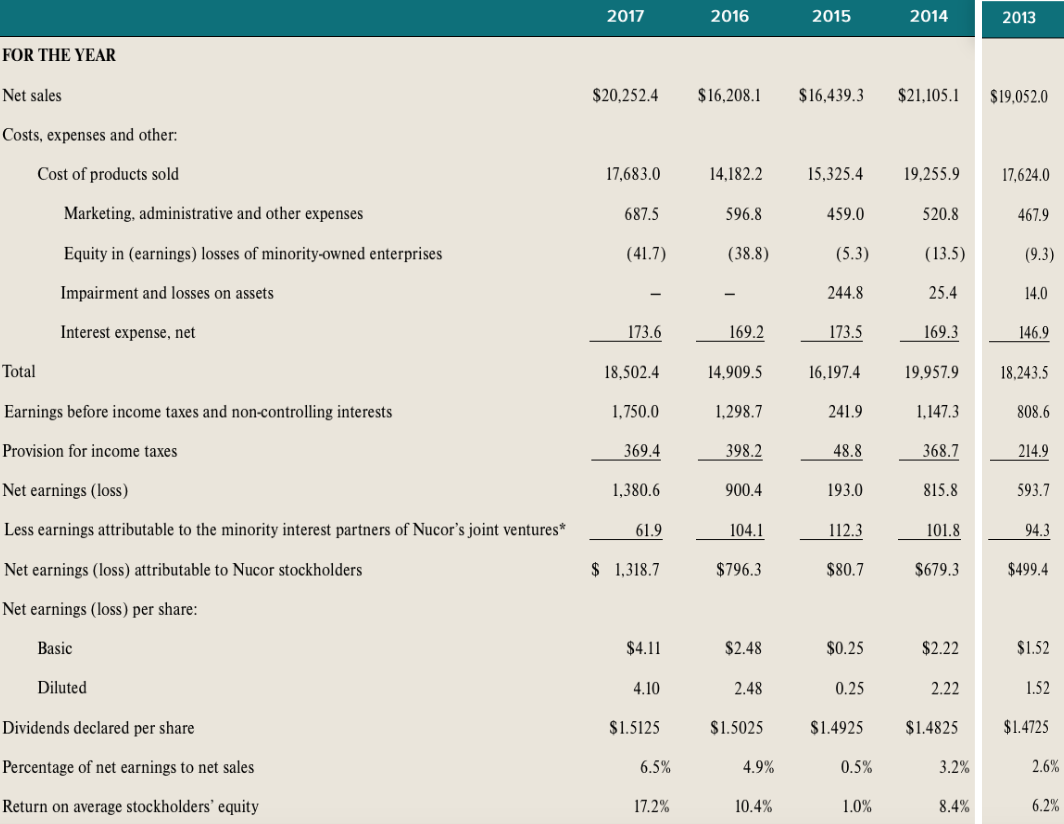
Do a comprehensive CAGR Analysis for each year.
2017 2016 2015 2014 2013 FOR THE YEAR Net sales $20,252.4 $16,208.1 $16,439.3 $21,105.1 $19,052.0 Costs, expenses and other: Cost of products sold 17,683.0 14,182.2 15,325.4 19,255.9 17,624.0 Marketing, administrative and other expenses 687.5 596.8 459.0 520.8 467.9 Equity in (earnings) losses of minority-owned enterprises (41.7) (38.8) (5.3) (13.5) (9.3) Impairment and losses on assets - 244.8 25.4 14.0 Interest expense, net 173.6 169.2 - 173.5 169.3 1469 Total 18,502.4 14,909.5 16,197.4 19,957.9 18,243.5 Earnings before income taxes and non-controlling interests 1,750.0 1,298.7 241.9 1,147.3 808.6 Provision for income taxes 369.4 398.2 48.8 368.7 214.9 Net earnings (loss) 1,380.6 900.4 193.0 815.8 593.7 Less earnings attributable to the minority interest partners of Nucor's joint ventures* 61.9 104.1 112.3 101.8 94.3 Net earnings (loss) attributable to Nucor stockholders $ 1,318.7 $796.3 $80.7 $679.3 $499.4 Net earnings (loss) per share: Basic $2.48 $0.25 $2.22 $4.11 4.10 $1.5125 Diluted 0.25 $1.52 1.52 2.22 2.48 $1.5025 Dividends declared per share $1.4925 $1.4825 $1.4725 Percentage of net earnings to net sales 6.5% 4.9% 0.5% 3.2% 2.6% Return on average stockholders' equity 17.2% 10.4% 1.0% 8.4% 6.2% 2017 2016 2015 2014 2013 FOR THE YEAR Net sales $20,252.4 $16,208.1 $16,439.3 $21,105.1 $19,052.0 Costs, expenses and other: Cost of products sold 17,683.0 14,182.2 15,325.4 19,255.9 17,624.0 Marketing, administrative and other expenses 687.5 596.8 459.0 520.8 467.9 Equity in (earnings) losses of minority-owned enterprises (41.7) (38.8) (5.3) (13.5) (9.3) Impairment and losses on assets - 244.8 25.4 14.0 Interest expense, net 173.6 169.2 - 173.5 169.3 1469 Total 18,502.4 14,909.5 16,197.4 19,957.9 18,243.5 Earnings before income taxes and non-controlling interests 1,750.0 1,298.7 241.9 1,147.3 808.6 Provision for income taxes 369.4 398.2 48.8 368.7 214.9 Net earnings (loss) 1,380.6 900.4 193.0 815.8 593.7 Less earnings attributable to the minority interest partners of Nucor's joint ventures* 61.9 104.1 112.3 101.8 94.3 Net earnings (loss) attributable to Nucor stockholders $ 1,318.7 $796.3 $80.7 $679.3 $499.4 Net earnings (loss) per share: Basic $2.48 $0.25 $2.22 $4.11 4.10 $1.5125 Diluted 0.25 $1.52 1.52 2.22 2.48 $1.5025 Dividends declared per share $1.4925 $1.4825 $1.4725 Percentage of net earnings to net sales 6.5% 4.9% 0.5% 3.2% 2.6% Return on average stockholders' equity 17.2% 10.4% 1.0% 8.4% 6.2%Step by Step Solution
There are 3 Steps involved in it
Step: 1

Get Instant Access to Expert-Tailored Solutions
See step-by-step solutions with expert insights and AI powered tools for academic success
Step: 2

Step: 3
Ace Your Homework with AI
Get the answers you need in no time with our AI-driven, step-by-step assistance
Get Started
Financial Accounting
Authors: Robert Kemp, Jeffrey Waybright
2nd edition
978-0132771801, 9780132771580, 132771802, 132771586, 978-0133052152