

Question
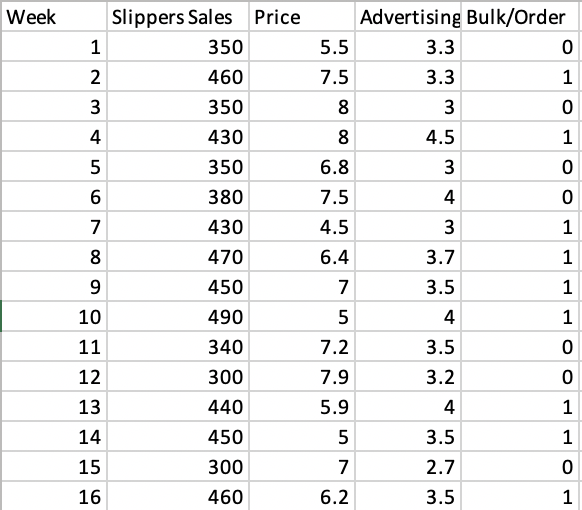
Do a multiple regression using Price ($/per unit), Advertising ($), Bulk Sales to predict Revenue for Slipper House LLC a Slipper manufacturer on Oahu.. Then
Do a multiple regression using Price ($/per unit), Advertising ($), Bulk Sales to predict Revenue for Slipper House LLC a Slipper manufacturer on Oahu.. Then use the results to predict Revenue on CEI tab with a 95% prediction interval estimate when price is = $ 5.00, Advertising = 3.5, and Bulk sales . Write up a report of your analysis. You should include the following in your report:
- Interpretation of R-squared, Adjusted R-squared, Mutiple R, and standard error and what these say about how good the regression is for predicting Revenue from the independent variables.
- Write, the equation (must include Coefficient numbers)
- Next interpretation of the 3 slopes. Which of these variables decrease revenues and which increase revenues? Use the proper units when you do the interpretations. Take care to interpret slopes for dummy variables appropriately.
- Write a hypotheses for the entire model. Also write a hypothesis for each individual variable and test with the T-Test which ones are slope Use significance at the =.05 for all.
- Should any terms be dropped? If so, which ones and why?
- Check the assumptions of linearity for Price and advertising (no need for the Bulk sales variable), This is Linearity, independence, Normality, and constant variability. All plots are given to you in the Residuals tab in the excel results file. PHStat does not create the linearity plots. Write a statement detailing what you found and recommendations for addressing any issues present.
- A statement explaining the results of the 95% prediction interval (from your CEI Tab).
- Now test statistically if there is evidence of an interaction for this by adding the interaction term Price x Advertisement and run the regression with all the terms. Explain the results and if this suggests you should add the interaction term to your model. Don't forget to explain why or why not!
Make sure you include relevant excel results you used for each part above.
Step by Step Solution
There are 3 Steps involved in it
Step: 1

Get Instant Access to Expert-Tailored Solutions
See step-by-step solutions with expert insights and AI powered tools for academic success
Step: 2

Step: 3
Ace Your Homework with AI
Get the answers you need in no time with our AI-driven, step-by-step assistance
Get Started
Financial Auditing With Information Technology Meeting The Challenge Of Cloud Computing Unstructured Data And Intangible Assets
Authors: J. Christopher Westland
1st Edition
149044873X, 978-1490448732