

Answered step by step
Verified Expert Solution
Question
1 Approved Answer
Do a Ratio analysis 2018 of Marico Bangladesh limited and with recommendations and conclusion? 2018 279 1 Assets 2 Fiscal year is April-March. All values
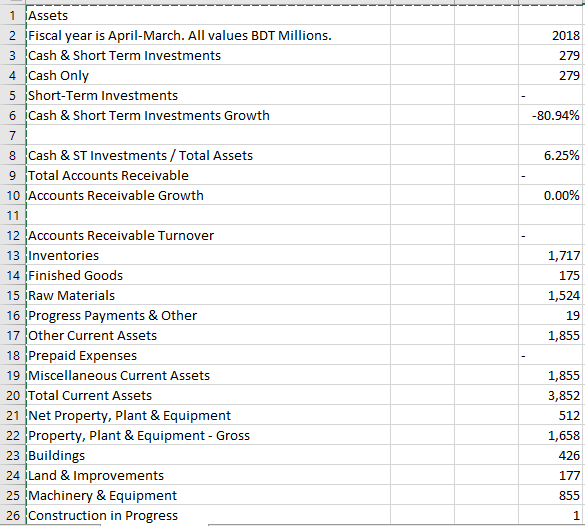
Do a Ratio analysis 2018 of Marico Bangladesh limited and with recommendations and conclusion?
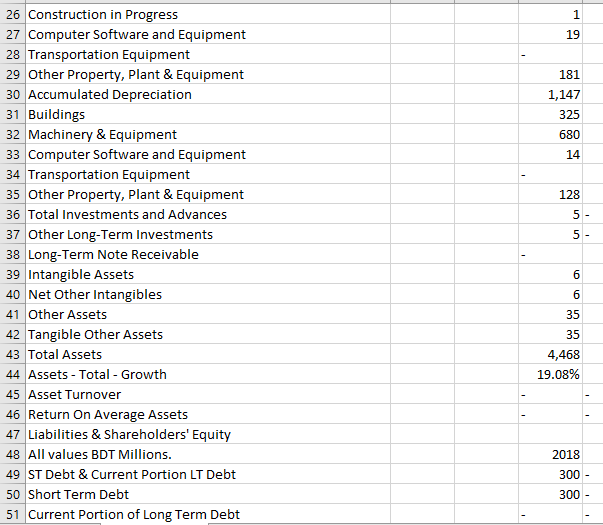
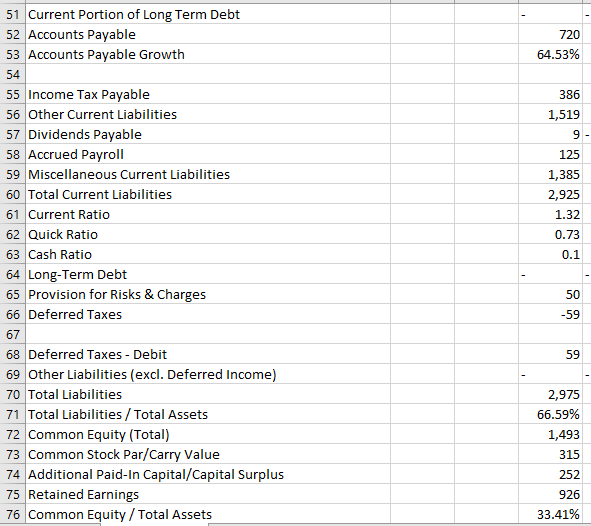
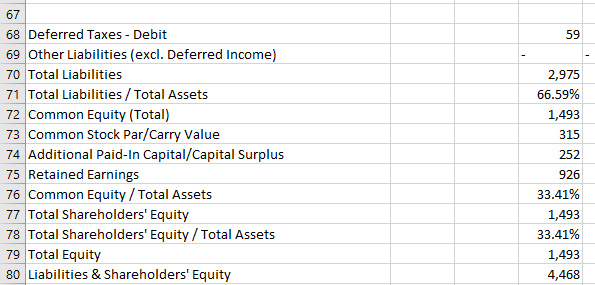
2018 279 1 Assets 2 Fiscal year is April-March. All values BDT Millions. 3 Cash & Short Term Investments 4 Cash Only 5 Short-Term Investments 6 Cash & Short Term Investments Growth 279 -80.94% 6.25% 0.00% 8 Cash & ST Investments / Total Assets 9 Total Accounts Receivable 10 Accounts Receivable Growth 11! 12 Accounts Receivable Turnover 13 Inventories 14 Finished Goods 15 Raw Materials 16 Progress Payments & Other 17 Other Current Assets 18 Prepaid Expenses 19 Miscellaneous Current Assets 20 Total Current Assets 21 Net Property, Plant & Equipment 22 Property, Plant & Equipment - Gross 23 Buildings 24 Land & Improvements 25 Machinery & Equipment 26 Construction in Progress 1,717 175 1,524 19 1,855 1,855 3,852 512 1,658 426 177 855 1 1 19 181 1,147 325 680 14 128 5 5 - 26 Construction in Progress 27 Computer Software and Equipment 28 Transportation Equipment 29 Other Property, Plant & Equipment 30 Accumulated Depreciation 31 Buildings 32 Machinery & Equipment 33 Computer Software and Equipment 34 Transportation Equipment 35 Other Property, Plant & Equipment 36 Total Investments and Advances 37 Other Long-Term Investments 38 Long-Term Note Receivable 39 Intangible Assets 40 Net Other Intangibles 41 Other Assets 42 Tangible Other Assets 43 Total Assets 44 Assets - Total - Growth 45 Asset Turnover 46 Return On Average Assets 47 Liabilities & Shareholders' Equity 48 All values BDT Millions. 49 ST Debt & Current Portion LT Debt 50 Short Term Debt 51 Current Portion of Long Term Debt 6 6 35 35 4,468 19.08% 2018 300 300 - 720 64.53% 386 1,519 9 125 1,385 2,925 1.32 0.73 0.1 51 Current Portion of Long Term Debt 52 Accounts Payable 53 Accounts Payable Growth 54 55 Income Tax Payable 56 Other Current Liabilities 57 Dividends Payable 58 Accrued Payroll 59 Miscellaneous Current Liabilities 60 Total Current Liabilities 61 Current Ratio 62 Quick Ratio 63 Cash Ratio 64 Long-Term Debt 65 Provision for Risks & Charges 66 Deferred Taxes 67 68 Deferred Taxes - Debit 69 Other Liabilities (excl. Deferred Income) 70 Total Liabilities 71 Total Liabilities/Total Assets 72 Common Equity (Total) 73 Common Stock Par/Carry Value 74 Additional Paid-In Capital/Capital Surplus 75 Retained Earnings 76 Common Equity/Total Assets 50 -59 59 2,975 66.59% 1,493 315 252 926 33.41% 59 2,975 66.59% 1,493 315 67 68 Deferred Taxes - Debit 69 Other Liabilities (excl. Deferred Income) 70 Total Liabilities 71 Total Liabilities/Total Assets 72 Common Equity (Total) 73 Common Stock Par/Carry Value 74 Additional Paid-In Capital/Capital Surplus 75 Retained Earnings 76 Common Equity / Total Assets 77 Total Shareholders' Equity 78 Total Shareholders' Equity/Total Assets 79 Total Equity 80 Liabilities & Shareholders' Equity 252 926 33.41% 1,493 33.41% 1,493 4,468Step by Step Solution
There are 3 Steps involved in it
Step: 1

Get Instant Access to Expert-Tailored Solutions
See step-by-step solutions with expert insights and AI powered tools for academic success
Step: 2

Step: 3
Ace Your Homework with AI
Get the answers you need in no time with our AI-driven, step-by-step assistance
Get Started
Principles Of Food Beverage And Labor Cost Controls
Authors: Paul R. Dittmer, J. Desmond Keefe
8th Edition
0471429929, 978-0471429920