

Question: Do it accurate . Dont use chat gpt Exercise 5.14. Consider the following three-player game, where only the payoffs of Player 1 are shown. Player
Do it accurate . Dont use chat gpt
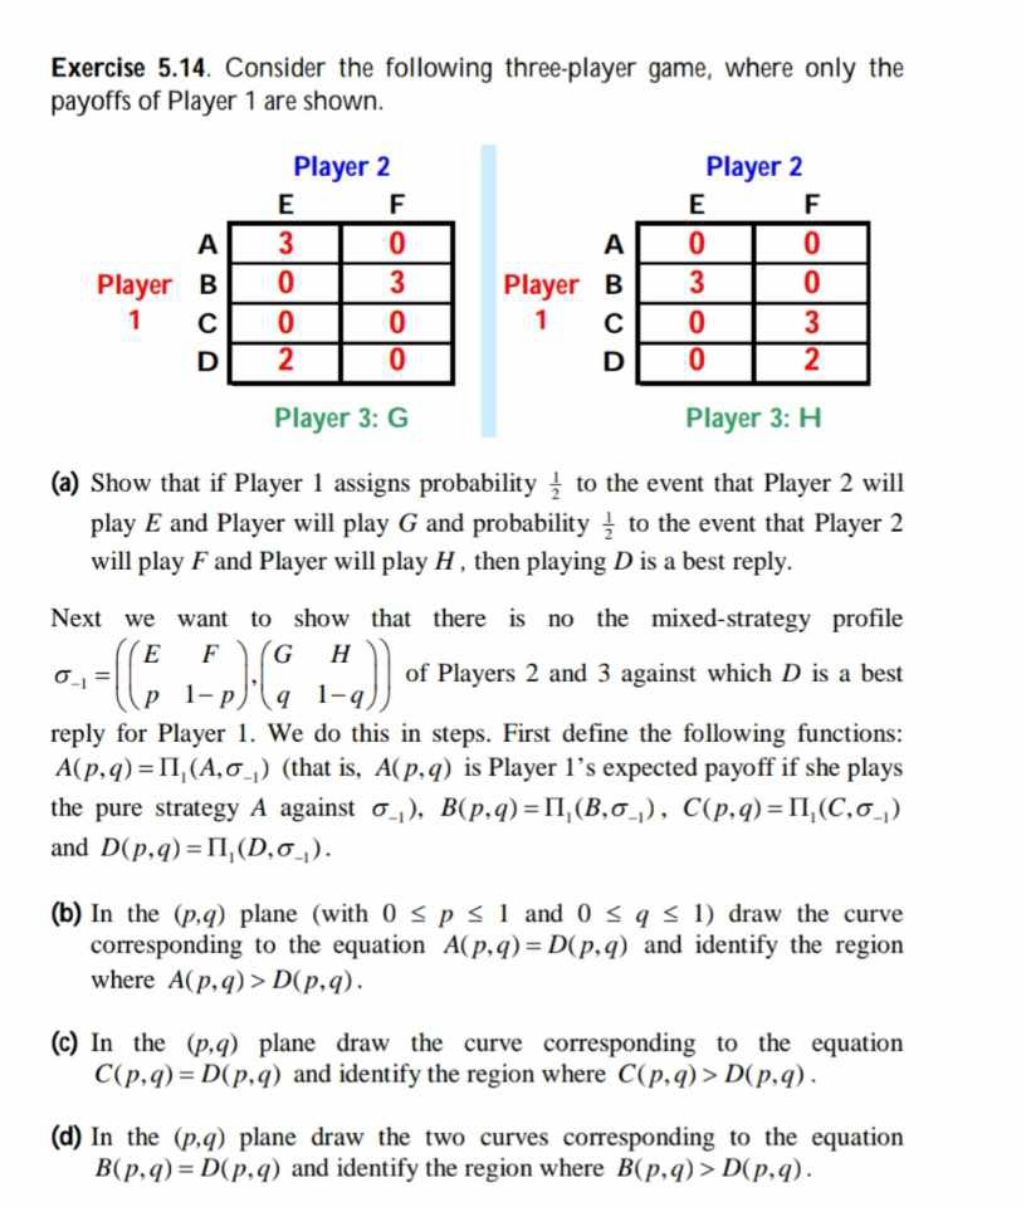
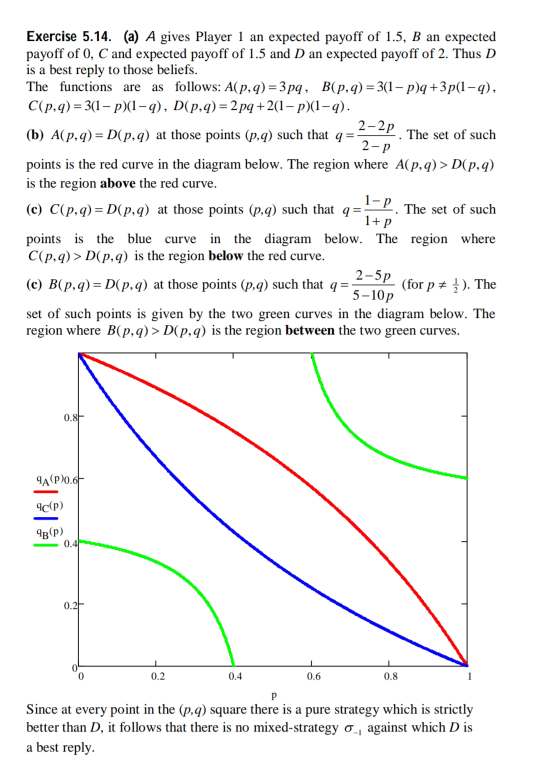
Exercise 5.14. Consider the following three-player game, where only the payoffs of Player 1 are shown. Player 2 E F A 0 Player Player B 3 0 3 OO N Player 3: G Player 3: H (a) Show that if Player 1 assigns probability ; to the event that Player 2 will play E and Player will play G and probability , to the event that Player 2 will play F and Player will play H, then playing D is a best reply. Next we want to show that there is no the mixed-strategy profile O_1 = E F G H p 1- p q 1-q) of Players 2 and 3 against which D is a best reply for Player 1. We do this in steps. First define the following functions: A(p, q) = II, (A.G_,) (that is, A(p. q) is Player 1's expected payoff if she plays the pure strategy A against _,). B(p.q) = II, (B.o_,). C(p.q) = II, (C.o_,) and D(p,q) = II, (D,o_,). (b) In the (p,q) plane (with 0 S p S 1 and 0 S q s 1) draw the curve corresponding to the equation A(p, q) = D(p, q) and identify the region where A(p, q) > D(p.q). (c) In the (p.q) plane draw the curve corresponding to the equation C(p,q) = D(p.q) and identify the region where C(p, q) > D(p.q). (d) In the (p,q) plane draw the two curves corresponding to the equation B(p, q) = D(p, q) and identify the region where B(p. q) > D(p. q).\fExercise 5.14. (a) A gives Player 1 an expected payoff of 1.5, B an expected payoff of 0. C and expected payoff of 1.5 and D an expected payoff of 2. Thus D is a best reply to those beliefs. The functions are as follows: A(p. q) =3pq. B(p.q) =3(1-p)q+3p(1-q). C(p.q) = 3(1-p)(1-q), D(p.q)=2pq+2(1-p)(1-q). (b) A(p.q) = D(p.q) at those points (p.q) such that q =- _ 2-2P. The set of such 2-P points is the red curve in the diagram below. The region where A(p. q) > D(p.q) is the region above the red curve. (c) C(p.q) = D(p.q) at those points (p.q) such that q=- . The set of such 1+p points is the blue curve in the diagram below. The region where C(p.q) > D(p.q) is the region below the red curve. (c) B(p.q) = D(p. q) at those points (p.q) such that 9 5-10p 2-3P (for p # { ). The set of such points is given by the two green curves in the diagram below. The region where B(p. q) > D(p. q) is the region between the two green curves. 0.8 4A( P)O.6 4c(p) 4p(P) 0.2 0.2 0.4 0.6 0.8 P Since at every point in the (p.q) square there is a pure strategy which is strictly better than D, it follows that there is no mixed-strategy o, against which D is a best reply
Step by Step Solution
There are 3 Steps involved in it

Get step-by-step solutions from verified subject matter experts