Answered step by step
Verified Expert Solution
Question
1 Approved Answer
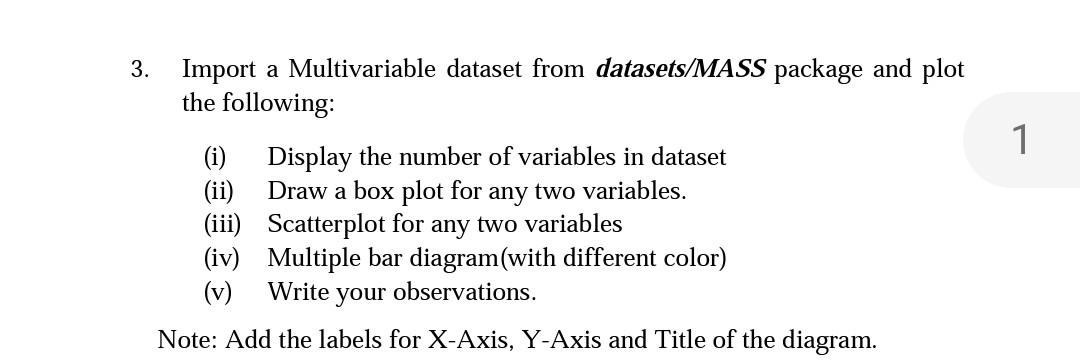
Do it in r programming language 3. Import a Multivariable dataset from datasets/MASS package and plot the following: (i) Display the number of variables in

Do it in r programming language
3. Import a Multivariable dataset from datasets/MASS package and plot the following: (i) Display the number of variables in dataset (ii) Draw a box plot for any two variables. (iii) Scatterplot for any two variables (iv) Multiple bar diagram(with different color) (v) Write your observations. Note: Add the labels for X-Axis, Y-Axis and Title of the diagramStep by Step Solution
There are 3 Steps involved in it
Step: 1

Get Instant Access to Expert-Tailored Solutions
See step-by-step solutions with expert insights and AI powered tools for academic success
Step: 2

Step: 3

Ace Your Homework with AI
Get the answers you need in no time with our AI-driven, step-by-step assistance
Get Started


