

Answered step by step
Verified Expert Solution
Question
1 Approved Answer
do not include money calculations Question 1: The exercise, although simple, has enough features to capture all the aspects that would be relevant even in
do not include money calculations 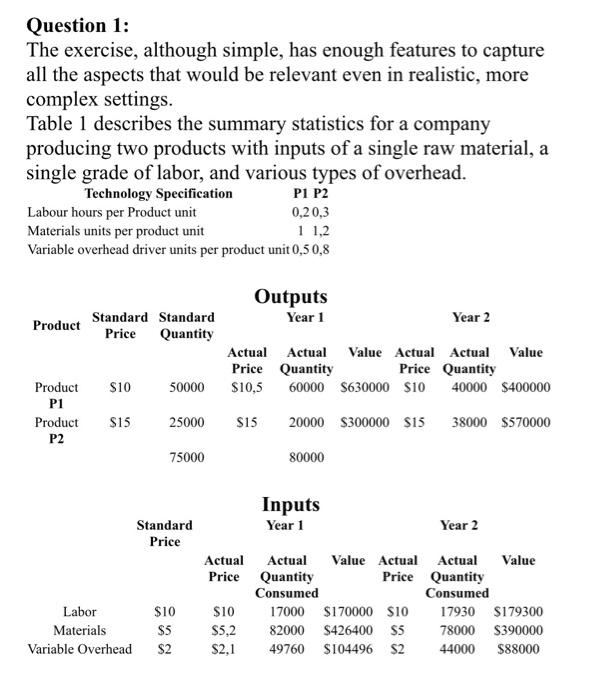
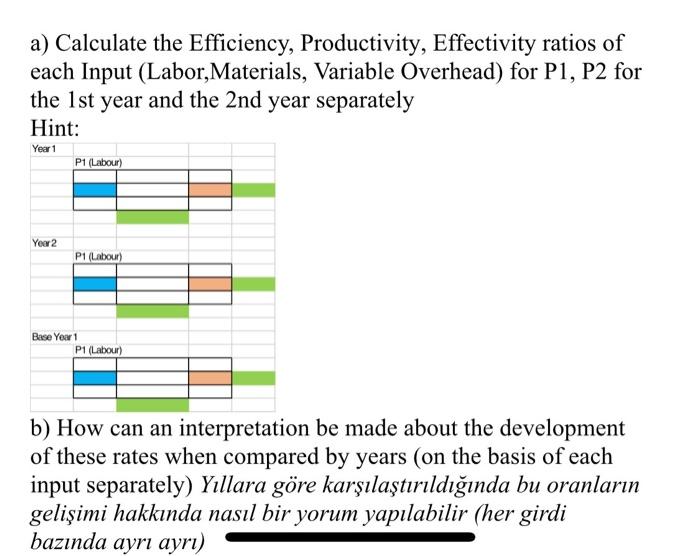
Question 1: The exercise, although simple, has enough features to capture all the aspects that would be relevant even in realistic, more complex settings. Table 1 describes the summary statistics for a company producing two products with inputs of a single raw material, a single grade of labor, and various types of overhead. Technology Specification P1 P2 Labour hours per Product unit 0,20,3 Materials units per product unit 1 1,2 Variable overhead driver units per product unit 0,5 0,8 Outputs Year 1 Standard Standard Price Quantity Year 2 Product Actual Actual Value Actual Actual Value Price Quantity Price Quantity $10,5 60000 $630000 $10 40000 $400000 $10 50000 Product P1 Product P2 $15 25000 $15 20000 $300000 $15 38000 $570000 75000 80000 Inputs Year 1 Standard Price Year 2 $10 Labor Materials Variable Overhead Actual Actual Value Actual Actual Value Price Quantity Price Quantity Consumed Consumed $10 17000 $170000 $10 17930 $179300 $5,2 82000 $426400 $5 78000 $390000 $2,1 49760 $104496 $2 44000 $88000 $5 $2 a) Calculate the Efficiency, Productivity, Effectivity ratios of each Input (Labor,Materials, Variable Overhead) for P1, P2 for the 1st year and the 2nd year separately Hint: Year 1 P1 (Labour) Year 2 P1 (Labour) Base Year 1 P1 (Labour) b) How can an interpretation be made about the development of these rates when compared by years (on the basis of each input separately) Yllara gre karlatrldnda bu oranlarn geliimi hakknda nasl bir yorum yaplabilir (her girdi baznda ayr ayr) Question 1: The exercise, although simple, has enough features to capture all the aspects that would be relevant even in realistic, more complex settings. Table 1 describes the summary statistics for a company producing two products with inputs of a single raw material, a single grade of labor, and various types of overhead. Technology Specification P1 P2 Labour hours per Product unit 0,20,3 Materials units per product unit 1 1,2 Variable overhead driver units per product unit 0,5 0,8 Outputs Year 1 Standard Standard Price Quantity Year 2 Product Actual Actual Value Actual Actual Value Price Quantity Price Quantity $10,5 60000 $630000 $10 40000 $400000 $10 50000 Product P1 Product P2 $15 25000 $15 20000 $300000 $15 38000 $570000 75000 80000 Inputs Year 1 Standard Price Year 2 $10 Labor Materials Variable Overhead Actual Actual Value Actual Actual Value Price Quantity Price Quantity Consumed Consumed $10 17000 $170000 $10 17930 $179300 $5,2 82000 $426400 $5 78000 $390000 $2,1 49760 $104496 $2 44000 $88000 $5 $2 a) Calculate the Efficiency, Productivity, Effectivity ratios of each Input (Labor,Materials, Variable Overhead) for P1, P2 for the 1st year and the 2nd year separately Hint: Year 1 P1 (Labour) Year 2 P1 (Labour) Base Year 1 P1 (Labour) b) How can an interpretation be made about the development of these rates when compared by years (on the basis of each input separately) Yllara gre karlatrldnda bu oranlarn geliimi hakknda nasl bir yorum yaplabilir (her girdi baznda ayr ayr) Step by Step Solution
There are 3 Steps involved in it
Step: 1

Get Instant Access to Expert-Tailored Solutions
See step-by-step solutions with expert insights and AI powered tools for academic success
Step: 2

Step: 3
Ace Your Homework with AI
Get the answers you need in no time with our AI-driven, step-by-step assistance
Get Started
Frank Woods Business Accounting Volume 1
Authors: Frank Wood, Alan Sangster
11th Edition
0273712128, 978-0273712121