Question
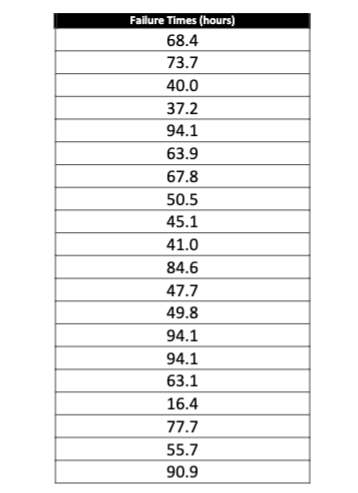
Do the following only C and D: a) Construct an empirical CDF for each asset. Please use the midpoint plotting positions. b) Construct a Weibull
Do the following only C and D: a) Construct an empirical CDF for each asset. Please use the midpoint plotting positions. b) Construct a Weibull Probability Plot for the asset using Excel or MATLAB and estimate Weibull parameters ( ). Comment on what you expect to see if a Weibull is a good fit for this data. c) Using the estimated parameters find the Mean time to failure d) Using the parameters found in part (b), compute the probability that a component (with identical failure characteristics) will survive another 10 hours, given that it has already survived up to 40 hours.
Step by Step Solution
There are 3 Steps involved in it
Step: 1

Get Instant Access to Expert-Tailored Solutions
See step-by-step solutions with expert insights and AI powered tools for academic success
Step: 2

Step: 3

Ace Your Homework with AI
Get the answers you need in no time with our AI-driven, step-by-step assistance
Get Started


