Question
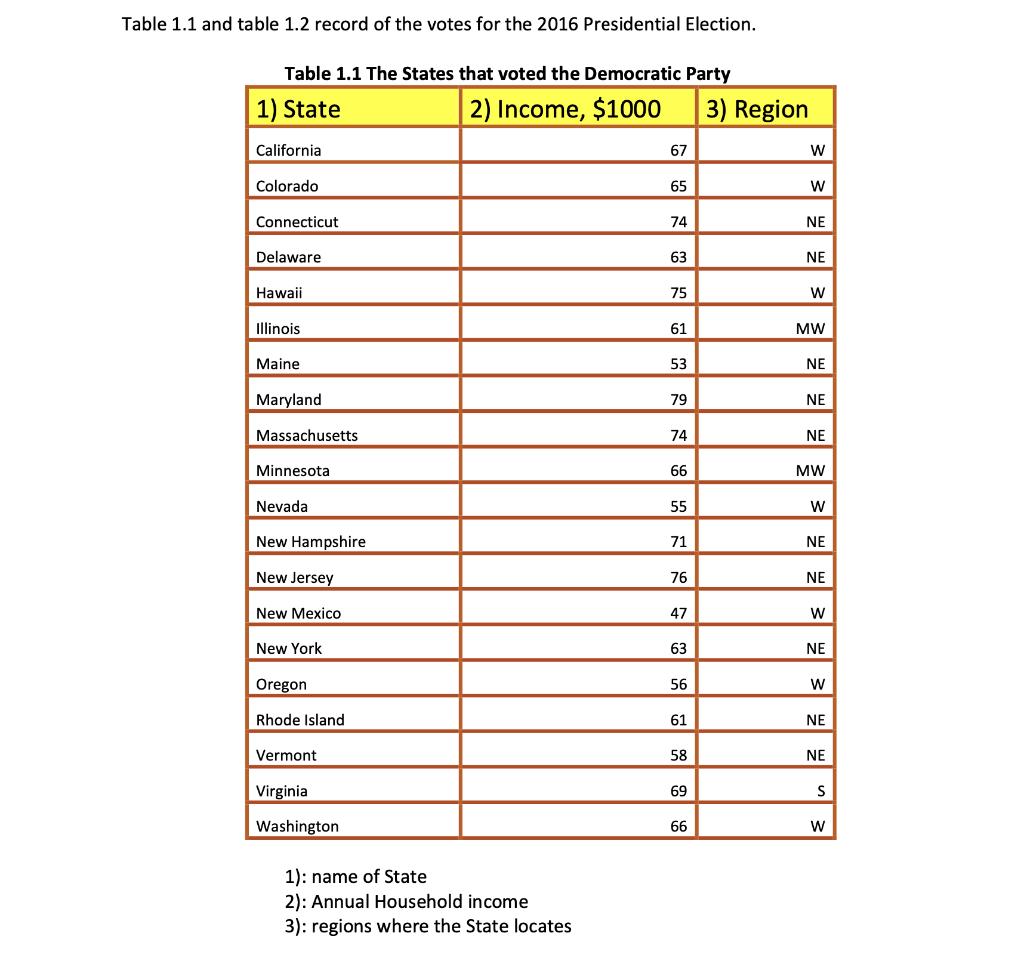
Do the following questions: a) construct two dot plots of regions by hands for the states that voted for the Democratic and for the Republic
Do the following questions:
a) construct two dot plots of regions by hands for the states that
voted for the Democratic and for the Republic respectively
b)construct two separate or one combined bar chart(s) of regions by hands, for the states that voted for the Democratic and for the Republic respectively
c) compare the voters for the Democratic and for the Republic from the perspective of location.
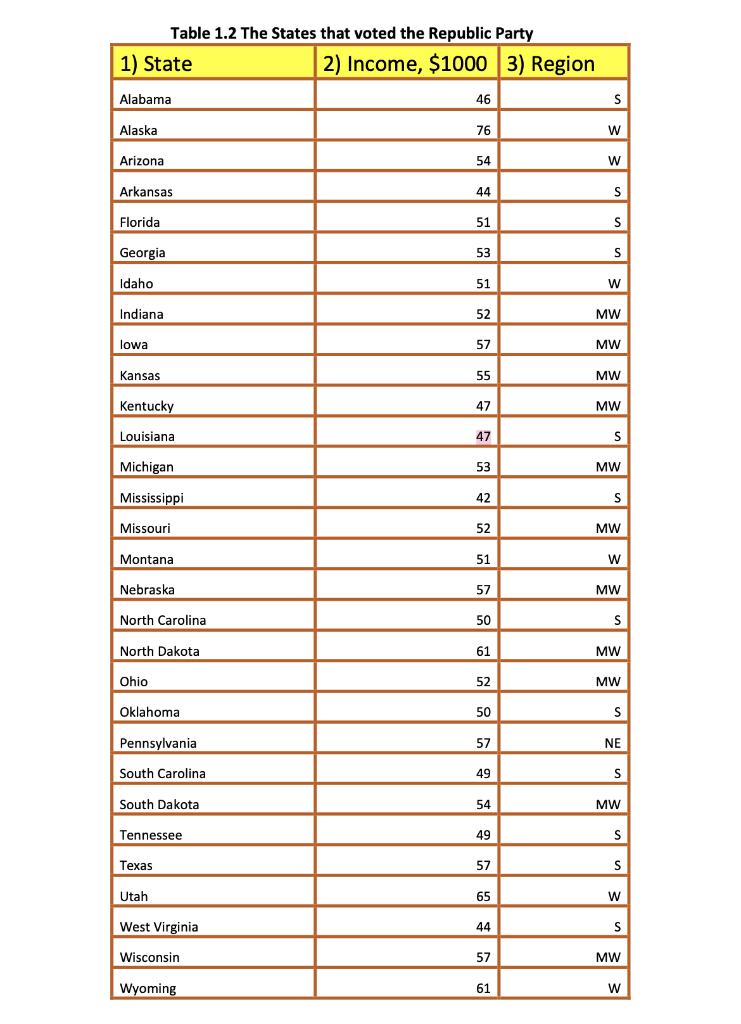
2. based on the data in Table 1.2
a) construct two relative frequencies of household annual income by hands for the states that voted for the Democratic and for the Republic respectively.
b)construct two histograms of relative frequencies of household annual income by hands for the states that voted for the Democratic and for the Republic respectively.
c) compare the voters for the Democratic and for the Republic from the perspective of household economic level.


Table 1.1 and table 1.2 record of the votes for the 2016 Presidential Election. Table 1.1 The States that voted the Democratic Party 1) State 2) Income, $1000 California Colorado Connecticut Delaware Hawaii Illinois Maine Maryland Massachusetts Minnesota Nevada New Hampshire New Jersey New Mexico New York Oregon Rhode Island Vermont Virginia Washington 1): name of State 2): Annual Household income 3): regions where the State locates 67 65 74 63 75 61 53 79 74 66 55 71 76 47 63 56 61 58 69 66 3) Region W W NE NE W MW NE NE NE MW W NE NE W NE W NE NE S W
Step by Step Solution
3.42 Rating (152 Votes )
There are 3 Steps involved in it
Step: 1
First Im sorry because I dont have graph paper but I hope it can help In making a rel...
Get Instant Access to Expert-Tailored Solutions
See step-by-step solutions with expert insights and AI powered tools for academic success
Step: 2

Step: 3

Ace Your Homework with AI
Get the answers you need in no time with our AI-driven, step-by-step assistance
Get Started


