do this in R if possible
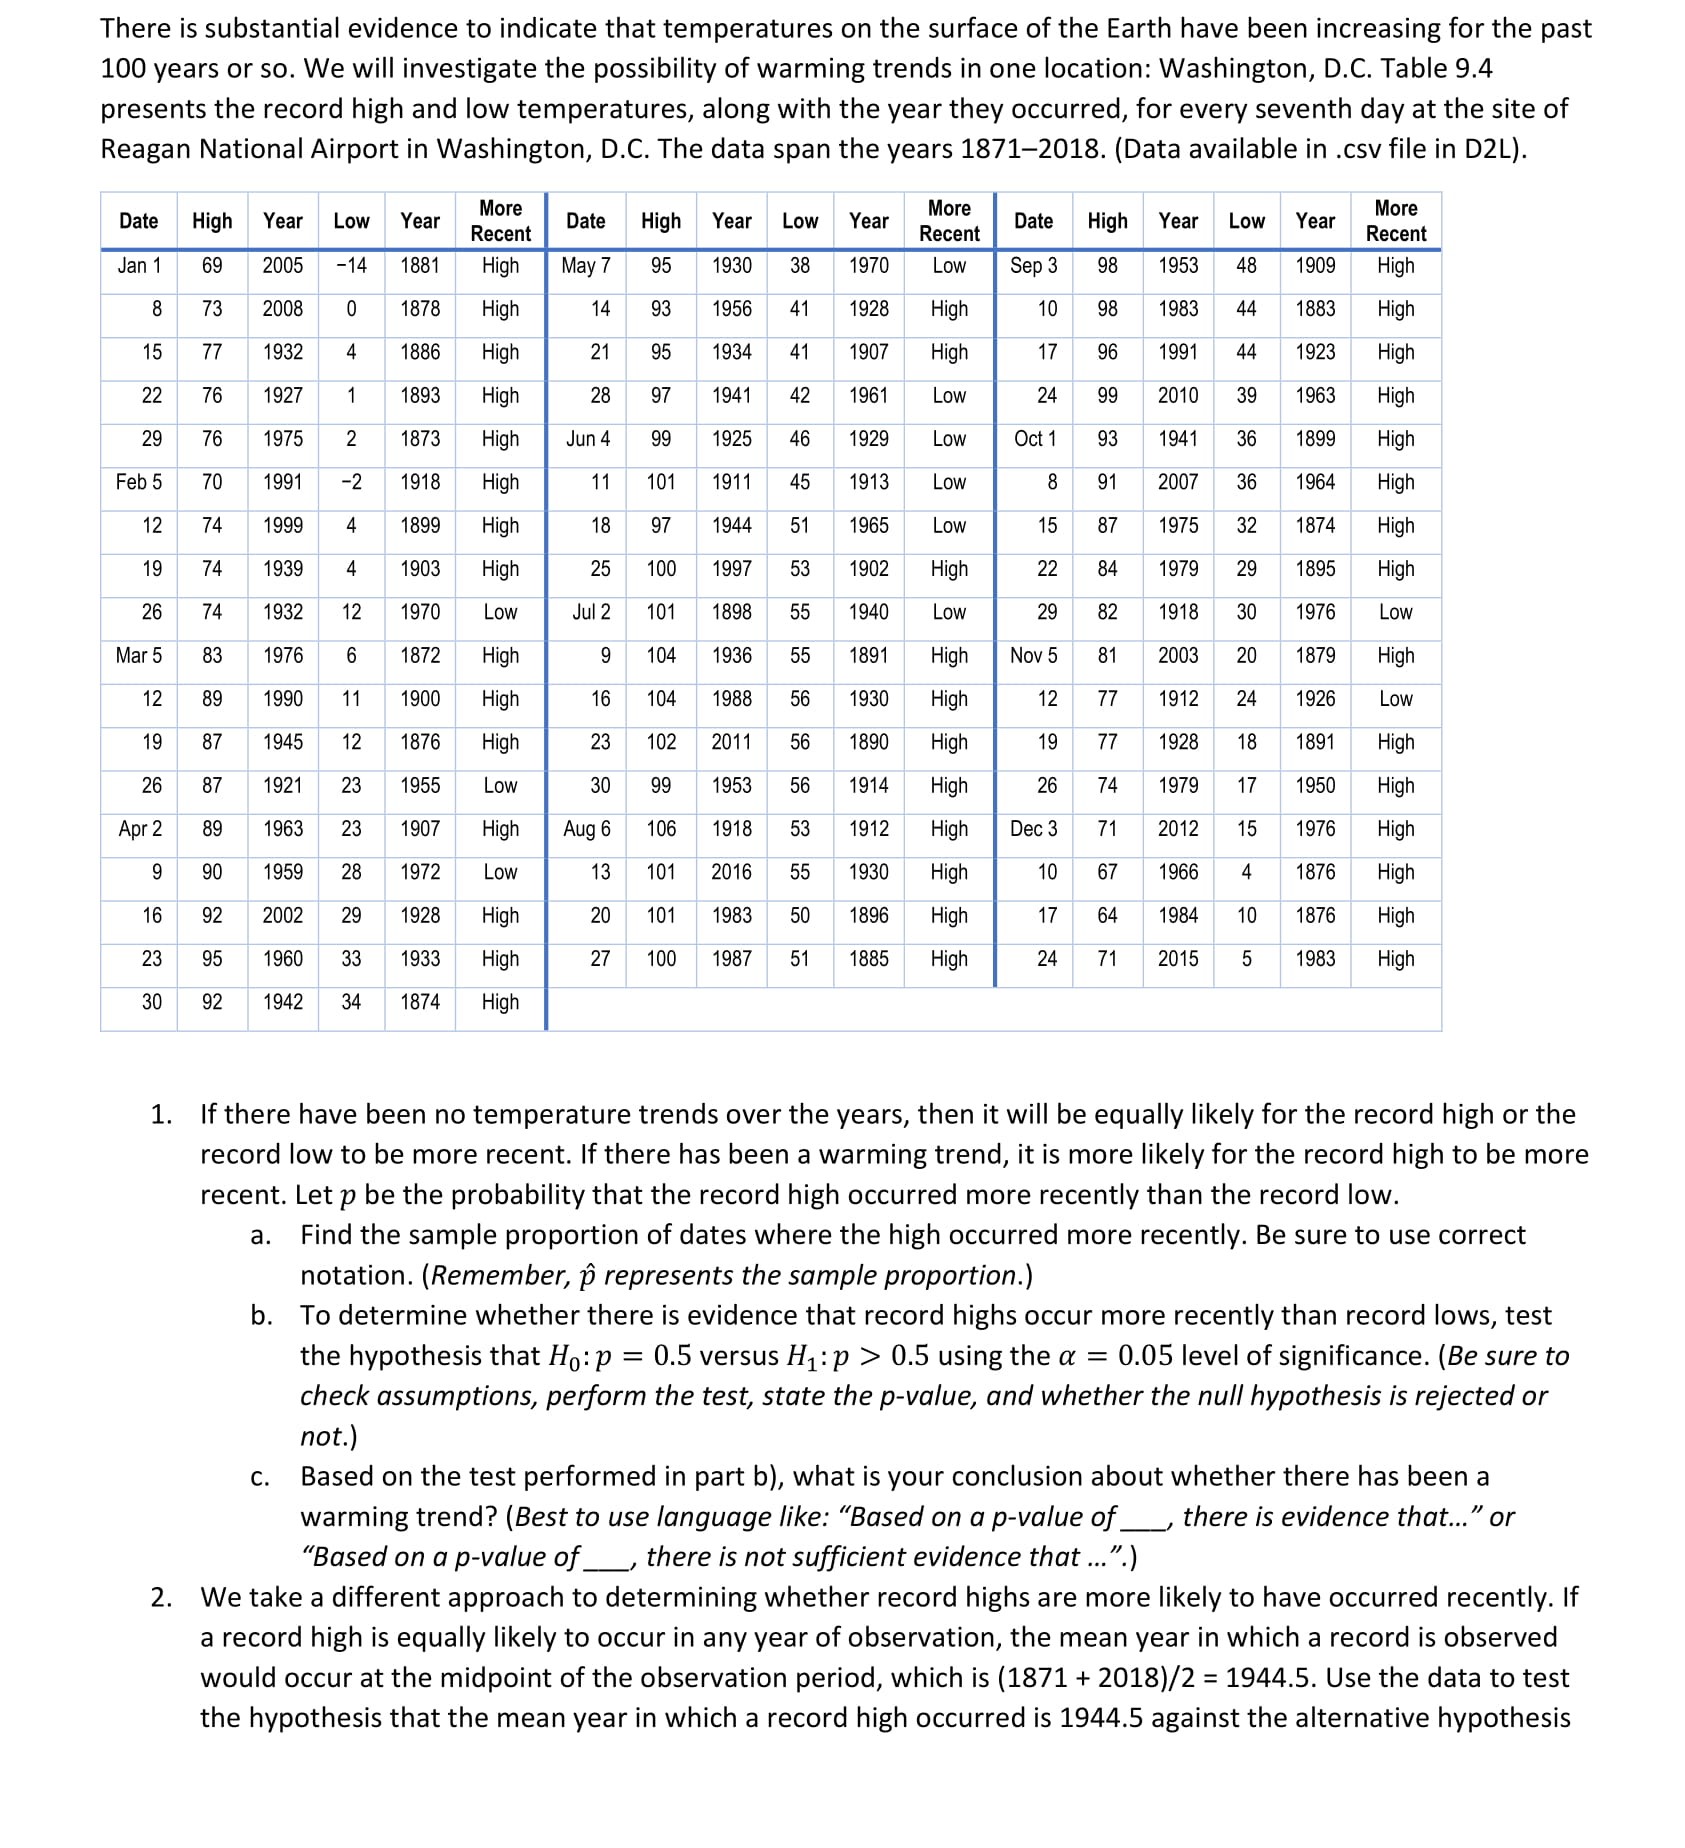
There is substantial evidence to indicate that temperatures on the surface of the Earth have been increasing for the past 100 years or so. We will investigate the possibility of warming trends in one location: Washington, D.C. Table 9.4 presents the record high and low temperatures, along with the year they occurred, for every seventh day at the site of Reagan National Airport in Washington, D.C. The data span the years 1871-2018. (Data available in .csv file in DL). More Year Low Year More Year Low Year More Date High Recent Date High Recent Date High Year Low Year Recent 48 1909 High 38 1970 Low Sep 3 98 1953 May 7 1930 High 95 Jan 1 69 2005 -14 1881 High 10 98 1983 44 1883 1878 High 14 93 1956 41 1928 High 73 2008 0 44 1923 High 95 1934 11 1907 High 17 96 1991 High 1 5 77 1932 4 1886 24 99 2010 39 1963 High 97 1941 12 1961 Low 76 1927 1893 High 28 22 Low Oct 93 194 36 1899 High 99 1929 76 1975 2 1873 High Jun 4 1925 9 91 2007 36 1964 High Low 3 High 17 101 1911 45 1913 Feb 5 70 1991 2 1918 87 1975 32 874 High Low 5 8 97 1944 51 1965 4 12 74 1999 1899 High 84 1979 29 1895 High 25 100 1997 3 1902 High 2 1903 High 9 74 1939 1918 976 Low 32 30 Low ul 2 107 1898 1940 Low 1932 12 1970 81 2003 1879 High Nov 5 20 High 9 104 1936 5 1891 High Mar 5 83 1976 6 1872 1912 24 1926 Low 77 104 1988 1930 High 12 89 1990 1900 High 6 12 1928 1891 High 2011 High 9 77 18 3 102 1890 9 87 1945 12 1876 High 26 74 1979 7 1950 High 30 1953 56 1914 High Low 26 87 1921 23 1955 High 1912 High Dec 3 71 2012 5 1976 High Aug 6 106 1918 53 Apr 2 89 1963 1907 4 High 10 67 1966 1876 1930 High 28 1972 Low 13 101 2016 65 9 90 1959 1876 High 1896 17 64 1984 10 High 101 1983 50 High 92 High 6 2002 29 1928 51 1885 High 24 71 2015 5 1983 27 100 1987 33 1933 High 23 95 1960 30 92 1942 34 1874 High 1. If there have been no temperature trends over the years, then it will be equally likely for the record high or the record low to be more recent. If there has been a warming trend, it is more likely for the record high to be more recent. Let p be the probability that the record high occurred more recently than the record low. Find the sample proportion of dates where the high occurred more recently. Be sure to use correct notation. (Remember, p represents the sample proportion.) b. To determine whether there is evidence that record highs occur more recently than record lows, test the hypothesis that Ho: p = 0.5 versus H1: p > 0.5 using the a = 0.05 level of significance. (Be sure to check assumptions, perform the test, state the p-value, and whether the null hypothesis is rejected or not.) Based on the test performed in part b), what is your conclusion about whether there has been a C. warming trend? (Best to use language like: "Based on a p-value of_, there is evidence that..." or "Based on a p-value of_, there is not sufficient evidence that ...".) 2. We take a different approach to determining whether record highs are more likely to have occurred recently. If a record high is equally likely to occur in any year of observation, the mean year in which a record is observed would occur at the midpoint of the observation period, which is (1871 + 2018)/2 = 1944.5. Use the data to test the hypothesis that the mean year in which a record high occurred is 1944.5 against the alternative hypothesisthat it is greater. (Be sure to state the null and alternate hypotheses, check assumptions, perform the test, state the p-value, whether the null hypothesis is rejected or not, and state a conclusion based on your p-value.) State a conclusion about whether record highs are more likely to have occurred recently. We take one more approach on the issue. If there has been a warming trend, then we would expect the mean year in which a record low occurred to be less than the midpoint of the observation period, 1944.5. Use the data to test the hypothesis that the mean year in which a record low occurred is 1944.5 against the alternative hypothesis that it is less. (Be sure to state the null and alternate hypotheses, check assumptions, perform the test, state the p-value, whether the null hypothesis is rejected or not, and state a conclusion based on your p- value.) State a conclusion about whether record lows are more likely to have occurred more in the past. Based on the hypothesis tests performed, describe how strong you believe the evidence to be that there has been a warming trend over the observation period