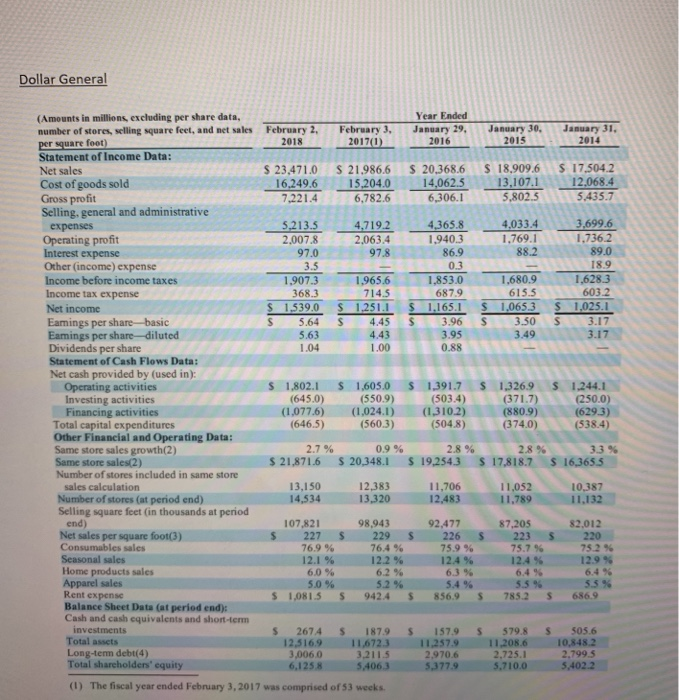
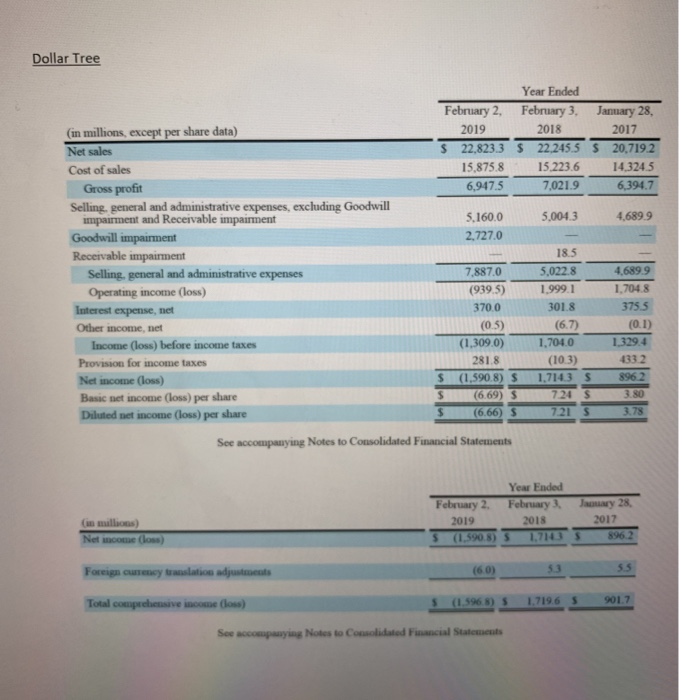
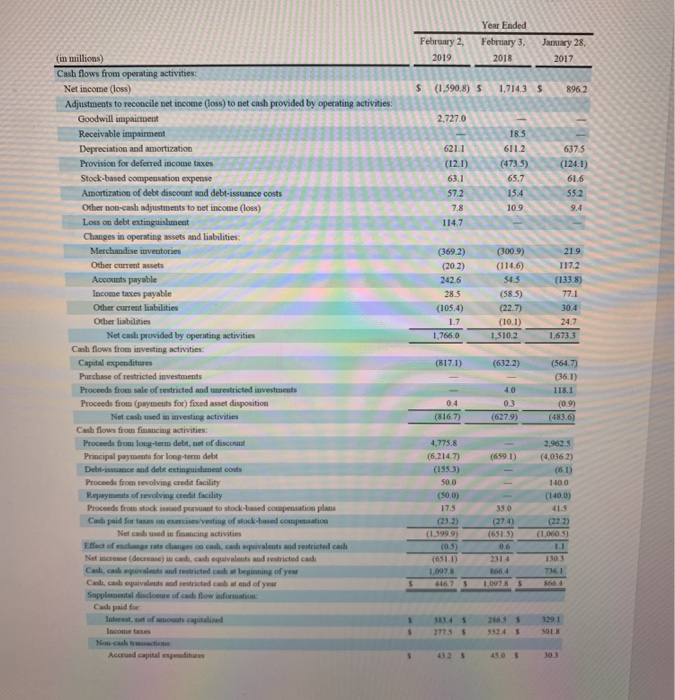
Dollar General (Amounts in millions excluding per share data, number of stores, selling square feet, and net sales February 2, February 3, January 29.January 30.January 31 201820170)20162s 2014 Statement of Income Data: Net sales 17.504.2 23471.0 $ 21.986.6 $ 20,368.6 S 18.,909.6S 16,249.615.204.0 14,062.5 13,107.1 12,068.4 6,306.1 Cost of goods sold Gross proft Selling, general and administrative 5,435.7 6,782.6 5,213.5 4,7192 4365.8 4,0343699.6 1,940.3 86.9 expenses 1.736.2 2,007.8 97.0 2,063.4 ing profit 88.2 Other (income) expense Income before income taxes Income tax expense 19073 1.9656 1,853.0 687.9 1,628.3 603.2 1,965.6 1,680.9 S 1539.0 S1,251.11.165.1 $ 1,0653 1,025.1 S 5.64 S 4.45 3.96 S3.50 S Eamings per share basic Eamings per share-diluted Dividends per share Statement of Cash Flows Data: 0.88 Net cash provided by (used in): Operating activities s 1,802.1 S 1,60s0 (645.0) 1391.7 S 1,326.9S 1244.1 (503.4) (550.9) (250.0) (629.3) 374.0)(538.4) (880.9) (1,077.6) (1,024.) (13102) (646.5) Financing activities Total capital expenditures Other Financial and Operating Data: Same store sales growth(2) Same store sales(2) Number of stores included in same store sales calculation Number of stores (at period end) Selling square feet (in thousands at period end Net sales per square foot(3) (560.3) (504.8) 0.9 % 28 % 33% S 21,871.6 S 20348.1 S 19,2543S 17,818.7 S 163655 13,150 14,534 11,706 12,483 12,383 13,320 10,387 11,132 87,205 107,821 $ 227 229 S 226 S 223 S220 98,943 92,477 752 % 12.4 % 12.4% 12.1 % 6.0 % 12.2 % Home products sales Apparel sales Rent expense Balance Sheet Data (at period end) Cash and cash equivalents and short-term investments 5.2 S 1,0815 S 9424 856.9 S 7852 686.9 S 2674S1879 S 157.9 S579.8S 505.6 12,5169 11,6723 11,257.9 11,208.6 10,848.2 2,970.6 5,377.9 Total assets Long-term debt(4) Total sharcholders' equity 2.725.1 5,710.0 2.7995 ,0060 6,125.8 5,402.2 5,4063 (1) The fiscal year ended February 3,2017 was comprised of 53 weeks Year Ended February 2, February 3, January 28, 2019 2018 2017 in millions, except per share data) S 22,8233 $ 22.245.5 S 20,719.2 15,875.8 Net sales 15,223.6 14.3245 Cost of sales 7,021.9 6,394.7 6,947.5 Gross profit Selling, general and administrative expenses, excluding Goodwill impairment and Receivable impairment 5,160.0 5,0043 4,689.9 2,727.0 Goodwill impairment 18.5 4.689.9 7,887.0 5,022.8 Selling, general and administrative expenses Operating income (loss) Interest expense, net 1,7048 (939.5) 1,999.1 370.0 301.8 (6.7) 375.5 (05) Other income, net 1,704.0 13294 (1,309.0) Income (loss) before income taxes (10.3) 281.8 433 2 Provision for income taxes s (1,590.8) S1,7143 S 896.2 Net income (loss) (6.69) $ 3.80 Basic net income (loss) per share Diluted net income (loss) per share 21 S 3.78 (6.66) S See accompanying Notes to Consolidated Financial Statements Year Ended February 2, February 3 Jauary 28, 2017 (n mullions) 896.2 s (1.5908) 51,7143 5.3 5.5 (6.0) 5 (1.5968) 5 1,7196 5 901.7 Total comprehensive income (loss) Year Ended February 2, February 3. January 28, (in millions) 2019 2018 2017 Cash flows from operating activities: (1,5908) S 1,7143 S8962 Net income (loss) Adjustments to reconcile net income (loss) to net cash provided by operating activities: Goodwill impairment 2,727.0 18.5 Depreciation and amortization 621.1 611.2 Provision for deferred income taxes (124.I Stock-based compensation expense 63.1 65.7 61.6 Amortization of debt discount and debt-issuance costs 57.2 154 55.2 Other non-cash adjustments to net income (loss) 10.9 9.4 Loss on debt extinguishment 114.7 Changes in operating assets and liabilities: Merchandise inveutoties 21.9 (369.2) (300.9) Other current assets Accounts payable (114,6) (20.2) 242.6 (58.5) lncome taxes payable 77.1 28.5 Other current liabilities (22.7) 30.4 (105.4) Other liabilities 24.7 Net cash provided by operating activities 1,510.2 1,673.3 1,766.0 Cash flows from investing activities (817.1) (6322) (564.7) Purchase of restricted investments Proceeds from sale of restricted and unrestricted investments Proceeds from (payments for) fixed asset disposition (0.9) Net cash used in ianvesting activities (816.7) (6279) (483.6) Cash flows from financing activities Proceeds from long-termm debt, net of discount Principal paymeuts for long-term debt 4,775.8 2,9625 (6,214.7) (659.1)(4,0362) (1553) 140.0 Proceeds from revolving credit facility 50.0 Repaymeuts of revolving credit facility (50.0) (140.0) 415 Proceeds from stock issued pursuant to stock-based 17.5 35.0 (27.4) 23.2) 22.2) Net cash used in fiancing activities Effect of exchme" ratdanges oa cash, cash equivalents and restricted cash Net increase (decrease) in cash, cash equivaleuts and restricted cash Cash, cash equivalests and restricted cash at beginning of year Candi, cash eqaivaleuts and sestricted cash at end of year (651.1) 2314 130.3 36 1 1,097 8 8664 Cash paid for Interest, uet of amousts capitalized $ 3834 $ 2863 s 329.1 Income taxes S 27,5% 552.4 501.8 Accrued capital expeedibure $43.2% 45.0% 30.3 Make the Profitability Ratio calculation of 2018 for: Dollar General VS Dollar tree. 1)