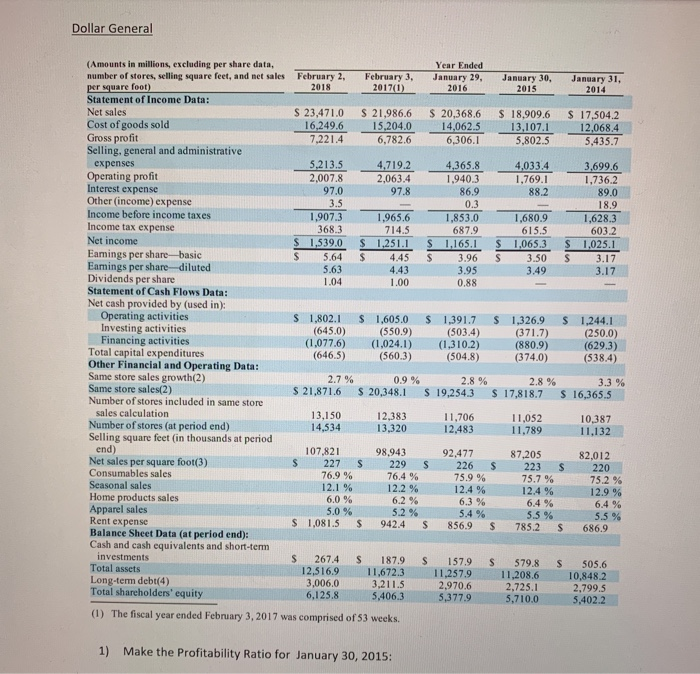
Dollar General (Amounts in millions, excluding per share data, number of stores, selling square feet, and net sales Year Ended February 2, February 3, January 29, January 30, January 31 Statement of Income Data: Net sales 23,4710 S 21,986.6 S 20,368.6 S 18,909.6 S 17,504.2 16249.6 15,204.0 14,062.5 13.107.1 12,068.4 7,221.4 6,782.613,107 5,802.5 Cost of goods sold Gross profit Selling, general and administrative 6,306.1 5,435.7 expenses Operating profit Interest expense Other (income) expense Income before income taxes Income tax expense 4,033.4 2,007.8 97.0 2,063.4 1,940.3 1,736.2 1,907.3 368.3 1,965.6 1,853.0 687.9 1,680.9 1,628.3 603.2 S 1,539.0 1,251.1 S 1,165.1 S 1,065.3 S 1,025.1 S 5.64 S 4.45 3.96 S3.50 S 3.17 Net income Eamings per share-basic Eamings per share -diluted Dividends per share Statement of Cash Flows Data: 3.49 Net cash provided by (used in): Operating activities Investing activities Financing activities Total capital expenditures Other Financial and Operating Data: Same store sales growth(2) Same store sales(2) Number of stores included in same store sales calculation Number of stores (at period end) Selling square feet (in thousands at period 1,802.1 S (645.0) (1,077.6) (1,024.1) (1310.2) (646.5) 1,605.0 1,391.7 S 1,326.9 S 1,244.1 (250.0) (629.3) (550.9) (503.4) (880.9) (374.0) (560.3) (504.8) 0.9 % S 21,871.6 S 20,348.1 19,254.3 S 17,818.7 16,365.5 13,150 14,534 12,383 13,320 11,706 12.483 11,052 11,789 10,387 107,821 227 229 226 223 220 76.9 % 98,943 92.477 87,205 82,012 Net sales per square foot(3) Consumables sales Seasonal sales Home products sales Apparel sales Rent expense Balance Sheet Data (at period end): Cash and cash equivalents and short-term 76.4 % 12.2 % 75.2 % 12.9 % 12.4 % 12.4 % 6.0 % 5.0% s 1,081.5 5.2 % 942.4 S 856.9 S 785.2 S 686.9 S 267.4 S 187.9 S 157.9 S 579.8 S 505.6 12,516.9 11,672.3 11,257911,208.610,848.2 3,006.0 6,125.8 investments Total assets Long-term debt(4) Total shareholders' equity 2,970.6 2,799.5 5,402.2 5,406.3 5,377.9 5,710.0 (1) The fiscal year ended February 3, 2017 was comprised of 53 weeks 1) Make the Profitability Ratio for January 30, 2015


