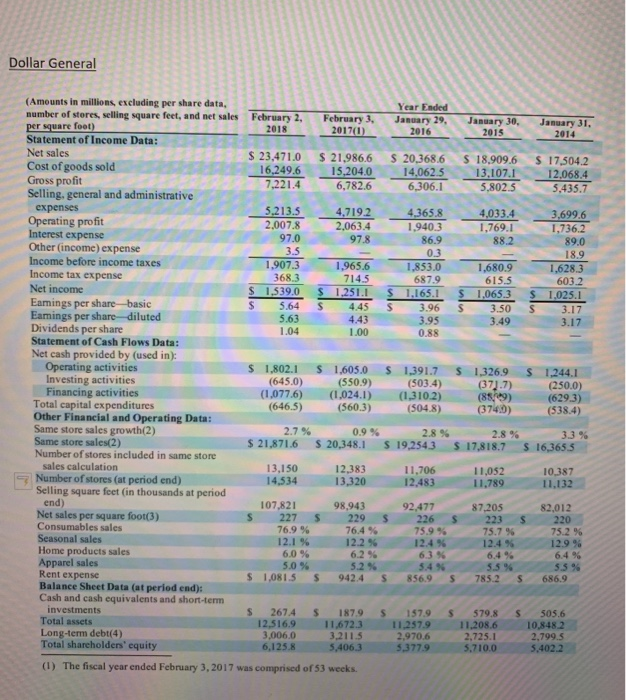
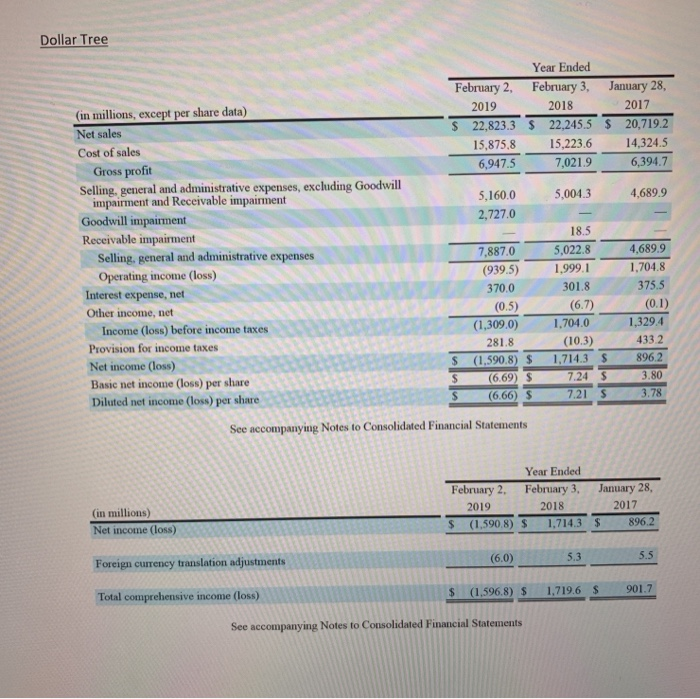
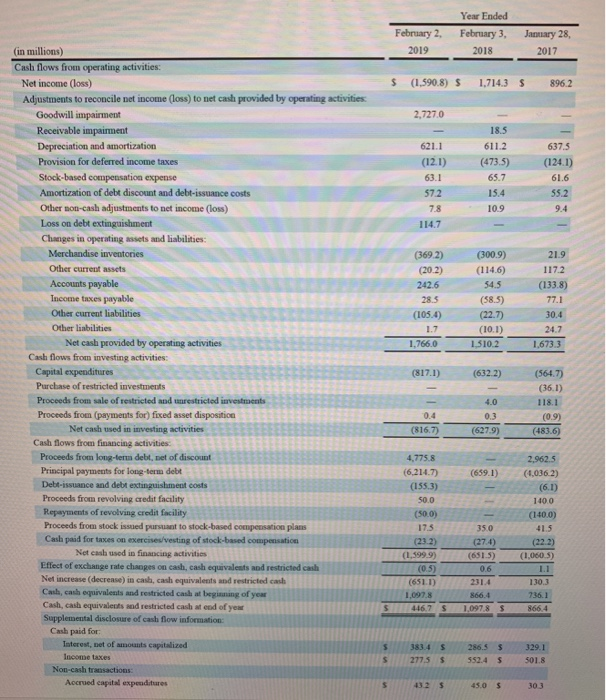
Dollar General (Amounts in millions, excluding per share data, number of stores, selling square feet, and net sales Year Ended February 2. February 3, January 29, January 30, Janus ry 31, 2017(1) 2016 2015 Statement of Income Data: Net sales 23,471.0 $ 21.986.6 $ 20,368.6 $ 18.909.6 $ 17.504.2 16,249.6 15204.014.062513.107.1 12.068.4 Cost of goods sold Gross proft Selling, general and administrative 6,782.6 6,306.1 58025 5,435.7 expenses Operating profit Interest expense Other (income) expense Income before income taxes 5.2135 443658 4,033436996 1,736.2 4.719.2 2,007.8 2,063.4 1,940.3 97.0 88.2 1,9073 19656 853.0 16809 1,628.3 1,853.0 687.9 Income tax expense Net income 368.3 603.2 S 1.539.0 S 125.L S 1.165.1 1.0653 1.025.1 S 5.64 S 445 S3.96 $ 3.50 S3.17 Eamings per share-basic Eamings per share-diluted Dividends per share Statement of Cash Flows Data: Net cash provided by (used in): 4.43 0.88 s 1,802.1 S 1,605.0 (645.0) (1,077.6) (1,024.1) (310.2) (646.5) 1,391.7 $ 13269 S 1244.1 (503.4) Investing activities Financing activities Total capital expenditures Other Financial and Operating Data: Same store sales growth(2) Same store sales(2) Number of stores included in same store (550.9) 371.7)250.0) (8509) (629.3) (538.4) (560.3) (504.8) 3740) 21,871.6S 20,348.1 S 19,2543 S 17,818.7 S 163655 sales calculation 13,150 12,383 11,706 14,53413,320 12,483 11,78911,132 11,052 10,387 7Number of stores (at period end) Selling square fcet (in thousands at period 107,821 98,943 s 227 $ 229 S 226 S 223 92,477 87.205 82,012 220 75.2 % 12.9 % Net sales per square foot(3) 76.9 % Seasonal sales 12.1 % 12.2 % 12.4 % Home products sales Apparel sales Rent expense Balance Sheet Data (at period end): Cash and cash equivalents and short-term investments Total assets 6.0 % 5.2 % S 1,081.5 S9424S 856.9 S 785.2S 686.9 S 2674S1879 S 1579 S 579.8S 505.6 12,516.9 11,672.3 11,257.911,208.6 10,848.2 2,970.6 5,377.9 Long-term debt(4) Total shareholders' equity 3,006.0 2.799.5 5,402.2 6,125.8 5,710.0 (1) The fiscal year ended February 3, 2017 was comprised of 53 weeks Dollar Tree Year Ended February 2, February 3, January 28, 2019 2018 (in millions, except per share data) 2017 S 22,823.3 S 22,245.5 S 20,719.2 Net sales 15,875.815,223.6 14,324.5 Cost of sales 69475 7,021.9 6,394.7 Gross profit Selling, general and administrative expenses, excluding Goodwill impairment and Receivable impairment Goodwill impairment Receivable impairment 5,160.0 2,727.0 4,689.9 5,004.3 18.5 Selling, general and administrative expenses Operating income (loss) Interest expense, net 7,887.0 5,022.8 4,689.9 1,704.8 (939.5) 1,999.1 375.5 301.8 370.0 Other income, net (0.5) (1,309.0) (6.7) Income (loss) before income taxes 1,329.4 1,704.0 Provision for income taxes (10.3) 433.2 281.8 Net income (loss) $ (1,590.8) $ 1,714.3 S896.2 Basic net income (loss) per share Diluted net income (loss) per shane 3.80 7.24 $ (6.69) S 7.21 S 3.78 (6.66) $ See accompanying Notes to Consolidated Financial Statements Year Ended February 2, February 3, January 28, (in millions) 2019 2018 2017 (1,590,8) $ 1,714.3 $ 896.2 Net income (loss) Foreign currency translation adjustments (6.0) 5.3 Total comprehensive income (loss) (1.596.8) s 1,719.6 $ 901.7 See accompanying Notes to Consolidated Financial Statements Year Ended February 2, February 3, January 28, 2019 (in millions) 2018 2017 Cash flows from operating activities S (1.590.8) S 1,7143 S896.2 Net income (loss) Adjustments to reconcile net income (loss) to net cash provided by operating activities 2,727.0 Goodwill impairment Receivable impairment Depreciation and amortization 621.1 611.2 637.5 (121) (473.5) (124.1) Provision for deferred income taxes Stock-based compensation expense 65.7 61.6 Amortization of debt discount and debt-issuance costs 15.4 57.2 55.2 Other non-cash adjustments to net income (loss) Loss on debt extinguishment 10.9 9.4 114.7 Changes in operating assets and liabilities: Merchandise inventories (369.2) (300.9) Other current assets Accounts payable (114.6) (20.2) (133.8) 242.6 4.5 Income taxes payable (58.5) 77.1 Other current liabilities (105.4) Other liabilities Net cash provided by operating activities 1.766.0 1,673.3 1,310.2 Cash flows from investing activities: Capital expenditures (817.1) (632.2) (564.7) Purchase of restricted investments Proceeds from sale of restricted and unrestricted investments 4.0 Proceeds from (payments for) fixed asset disposition (0.9) Net cash used in investing activities (627.9) (483.6) Cash flows from financing activities Proceeds from long-tera debt, pet of discount 4,7758 2,962.5 Principal payments for long-term debt (659.1) (4,0362) (6,214.7) Debt-issuance and debt exctinguishment costs Proceeds from revolving credit facility Repayments of revolving credit facility Proceeds from stock issued pursuant to stock-based compensation plans (155.3) 50.0 1400 (50.0) (140.0) 17.5 Cash paid for taxes on exercises/vesting of stock-based compensation (27.4) (22.2) Net cash used in financing activities (1,5999) (0.5) (1,060.5) Effect of exchange rate changes on cash, cash equivalests and restricted cash Net increase (decrease) in cash, cash equivalents and restricted cash Cash, cash equivalents and restricted cash at beginning of year Cash, cash equivalents and restricted cash at eod of yea (651.1) 130.3 1,097.8 736.1 866.4 446.7 S 1,097.8 $ 8664 Supplemental disclosure of cash flow information: Cash paid for: Interest, net of amounts capitalized s 383.4 S 286.5 $ 329.1 Income taxes S 2775 552.4S501.8 Non-cash transactions Accrued capital expeaditures 432 5 45.0 30.3 Make the Profitability Ratio calculation of 2017 for: Dollar General vs Dollar tree. 1)