Question
Dominos is the largest pizza company in the world with more than 18,800 locations in over 90 markets around the world as of January 2,
Domino’s is the largest pizza company in the world with more than 18,800 locations in over 90 markets around the world as of January 2, 2022, and operates two distinct service models within its stores with a significant business in both delivery and carryout. We are a highly recognized global brand, and we focus on value while serving neighborhoods locally through our large worldwide network of franchise owners and U.S. Company-owned stores. We are primarily a franchisor, with approximately 98% of Domino’s stores currently owned and operated by our independent franchisees.
The Domino’s business model is straightforward: Domino’s stores handcraft and serve quality food at a competitive price, with easy ordering access and efficient service, enhanced by our technological innovations. Our hand-tossed dough is made fresh and distributed to stores around the world by us and our franchisees.
Domino’s generates revenues and earnings by charging royalties and fees to our franchisees. Royalties are ongoing percent-of-sales fees for use of the Domino’s® brand marks. We also generate revenues and earnings by selling food, equipment and supplies to franchisees through our supply chain operations, primarily in the U.S. and Canada, and by operating a number of Company-owned stores in the United States. Franchisees profit by selling pizza and other complementary items to their local customers. In our international markets, we generally grant geographical rights to the Domino’s Pizza® brand to master franchisees. These master franchisees are charged with developing their geographical area, and they may profit by sub-franchising and selling food and equipment to those sub-franchisees, as well as by running pizza stores.
We offer a menu designed to present an attractive, quality offering to customers, while keeping it simple enough to minimize order errors and expedite order-taking and food preparation. Our basic menu features pizza products with varying sizes and crust types. Our typical store also offers oven-baked sandwiches, pasta, boneless chicken and chicken wings, bread and dips side items, desserts and soft drink products. International markets vary toppings by country and culture, such as the Cheese and Corn pizza in India, or the Octopus Bomb Shrimp in Korea, featuring shrimp, octopus, vegetables, feta cream and horseradish sauce.
We operate, and report, three business segments: U.S. stores, international franchise and supply chain.
U.S. Stores
Our U.S. stores segment consists primarily of our franchise operations, which consisted of 6,185 franchised stores located in the United States as of January 2, 2022. We also operated a network of 375 U.S. Company-owned stores as of January 2, 2022. Under the current standard franchise agreement, we assign an exclusive area of primary responsibility to each franchised store. Each franchisee is generally required to pay a 5.5% royalty fee on sales, as well as certain technology fees. In certain instances, we will collect lower rates based on certain incentives.
International Franchise
This segment is comprised of a network of franchised stores in more than 90 international markets. As of January 2, 2022, we had 12,288 international franchise stores. The principal sources of revenues from those operations are royalty payments generated by retail sales from franchised stores, as well as certain technology fees. Our international franchisees employ our basic standard operating model and adapt it to satisfy the local eating habits and consumer preferences of various regions outside the U.S. Currently, our ten largest international markets (India, United Kingdom, Japan, Mexican, Australia, Turkey, Canada, South Korea, China and France) accounted for 62% of our international stores.
Supply Chain
We operate 21 regional dough manufacturing and supply chain centers in the U.S., two thin crust manufacturing facilities, one vegetable processing center and one center providing equipment and supplies to our U.S. and certain international stores. We also operate five dough manufacturing and supply chain centers in Canada. We plan to continue investing in additional supply chain centers and capacity initiatives in the future, including one additional regional dough manufacturing and supply chain center that is expected to open in fiscal 2022. Our supply chain segment leases a fleet of more than 900 tractors and trailers. Our centers produce fresh dough and purchase, receive, store and deliver quality food and other complementary items to substantially all of our U.S. stores and most of our Canadian franchised stores. We regularly supply over 7,100 stores with various food and supplies.
We believe our franchisees voluntarily choose to obtain food, supplies and equipment from us because we offer the most efficient, convenient and cost-effective alternative, while also offering both quality and consistency. Our supply chain segment offers profit-sharing arrangements to U.S. and Canadian franchisees who purchase all of their food for their stores from our centers. These profit-sharing arrangements generally offer participating franchisees and Company-owned stores with 50% (or a higher percentage in the case of Company-owned stores and certain franchisees who operate a larger number of stores) of the pre-tax profit from our supply chain center operations. We believe these arrangements strengthen our ties to and provide aligned benefits with franchisees.
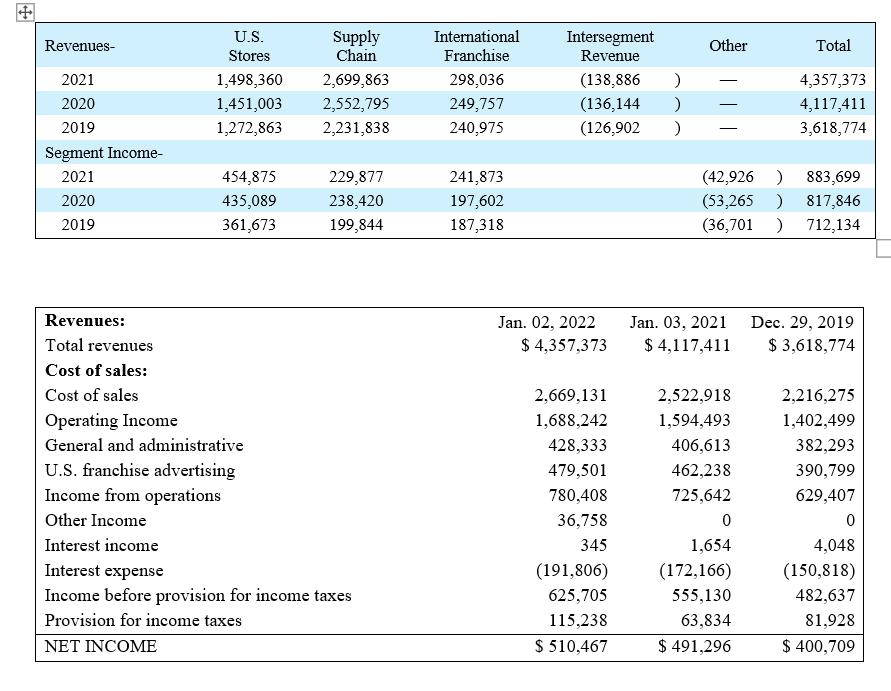
The tables below summarize the financial information concerning the Company’s reportable segments for fiscal 2021, 2020 and 2019. Intersegment revenues are comprised of sales of food, equipment and supplies from the supply chain segment to the Company-owned stores in the U.S. stores segment. Intersegment sales prices are market based. The “Other” column as it relates to Segment Income below primarily includes corporate administrative costs that are not allocable to a reportable segment, including labor, computer expenses, professional fees, travel and entertainment, rent, insurance and other corporate administrative costs.

PAPA JOHN’S
Papa John’s International, Inc., operates and franchises pizza delivery and carryout restaurants and, in certain international markets, dine-in and delivery restaurants under the trademark “Papa John’s”. Papa John’s began operations in 1984. At December 26, 2021, there were 5,650 Papa John’s restaurants in operation, consisting of 600 Company-owned and 5,050 franchised restaurants operating in 50 countries and territories. Our Company-owned restaurants include 188 restaurants operated under four joint venture arrangements. All of the 2,311 international restaurants are franchised.
Strategy
We are committed to delivering on our brand promise “BETTER INGREDIENTS. BETTER PIZZA.®” and a business strategy designed to drive sustainable long-term, profitable growth. We believe that using high quality ingredients leads to superior quality pizzas. Our original crust pizza dough is made from six simple ingredients and is fresh, never frozen. We also top our pizzas with real cheese made from mozzarella, pizza sauce made with vine-ripened tomatoes, and meat free of fillers. Our marketing and menu strategies emphasize the quality of our ingredients and our new product innovations to accelerate sales. One of our most recent menu innovations, the new Epic Stuffed Crust pizza, was officially launched in the first quarter of 2021 and has been one of our most successful launches to date. The Epic Stuffed Crust pizza, and other menu innovations like our recently announced New York Style pizza, along with Garlic Parmesan Crust, toasted handheld “Papadias” flatbread-style sandwiches and Jalapeno Popper Rolls launched in 2020, demonstrates our commitment to building new long-term sustainable menu products on which we can continue to innovate. These products form the foundation of our growing comparable sales and improving unit economics.
We continue to pursue a growth strategy by expanding our footprint, both domestically and internationally. In August 2021, we announced our expanded partnership with Drake Food Service International to open over 220 restaurants across Latin America, Spain, Portugal and the United Kingdom (“UK”) by 2025. In September 2021, we announced the Company's largest domestic development deal ever with Sun Holdings, who will open 100 new locations in high-growth markets in Texas and the South by 2029. Most recently, in January 2022, we announced a partnership with FountainVest Partners, one of Asia’s leading independent private equity firms, to open more than 1,350 new stores across South China by 2040, the largest franchisee development agreement in our history.
A large majority of Papa John’s restaurants are franchised. We believe a franchised model provides resiliency of earnings and presents us with an opportunity to enhance growth with less capital investment than a traditional company-operated restaurant model. While each Papa John’s franchisee manages and operates its own restaurants and business, we devote significant resources to providing franchisees with assistance in restaurant operations, quality assurance, technology, training, marketing, site selection and restaurant design. Papa John’s franchise owners benefit from our award-winning brand, food service capabilities and the Papa John’s digital and delivery model.
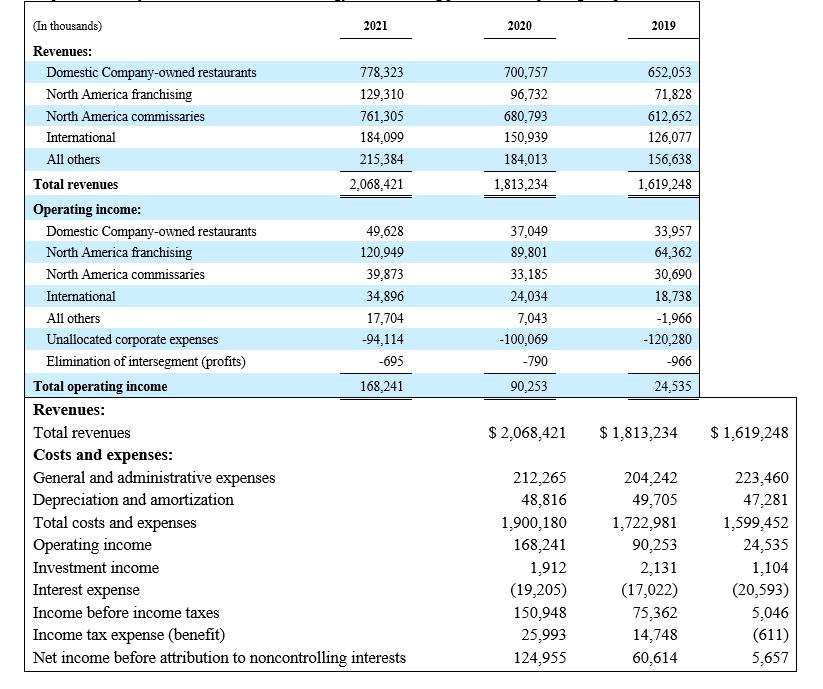
Papa John’s has four defined reportable segments: Domestic Company-owned restaurants, North America commissaries (Quality Control Centers), North America franchising and International operations.
Domestic Company-owned Restaurants
The Domestic Company-owned restaurant segment consists of the operations of all domestic Company-owned restaurants and derives its revenues principally from retail sales of pizza, Papadias, and side items, including breadsticks, cheesesticks, chicken poppers and wings, dessert items and canned or bottled beverages.
Of the total 3,339 North American restaurants open as of December 26, 2021, 600 units, or approximately 18%, were Company-owned. In 2021, the 579 domestic Company-owned restaurants included in the full year’s comparable restaurant base generated average annual unit sales of $1.3 million. Operating Company-owned restaurants allows us to improve operations, training, marketing and quality standards for the benefit of the entire Papa John’s system.
North America commissary
The North America commissary segment comprises 11 full-service regional dough production and distribution Quality Control Centers (“QC Centers”) in the United States (“U.S.”), which supply pizza sauce, dough, food products, paper products, smallwares and cleaning supplies twice weekly to each traditional restaurant served. This system enables us to monitor and control product quality and consistency while lowering food and other costs. We also have one QC Center in Canada, which produces and distributes fresh dough. We evaluate the QC Center system capacity in relation to existing restaurants’ volumes and planned restaurant growth, and facilities are developed or upgraded as operational or economic conditions warrant. To ensure consistent food quality, each domestic franchisee is required to purchase dough and pizza sauce from our QC Centers and to purchase all other supplies from our QC Centers or other approved suppliers.
North America franchising
The North America franchising segment consists of our franchise sales and support activities and derives its revenues from the sale of franchise and development rights and the collection of royalties from our franchisees located in the United States and Canada. Our North American franchised restaurants, which included 2,384 restaurants in the full year’s comparable base for 2021, generated average annual unit sales of $1.1 million. These sales, while not included in the Company’s revenues, contribute
to our royalty revenues, franchisee marketing fund contributions, and commissary revenue.
International
The International segment principally consists of distribution sales to franchised Papa John’s restaurants located in the UK and our franchise sales and support activities, which derive revenues from sales of franchise and development rights and the collection of royalties from our international franchisees. International franchisees are defined as all franchise operations outside of the United States and Canada. As of December 26, 2021, there were 2,311 international restaurants, all of which are franchised.
All others
These consist of operations that derive revenues from franchise contributions to our marketing funds and the sale, principally to Company-owned and franchised restaurants, of information systems and related services used in restaurant operations, including our point-of-sale system, online and other technology-based ordering platforms, and printing and promotional items.


Question:
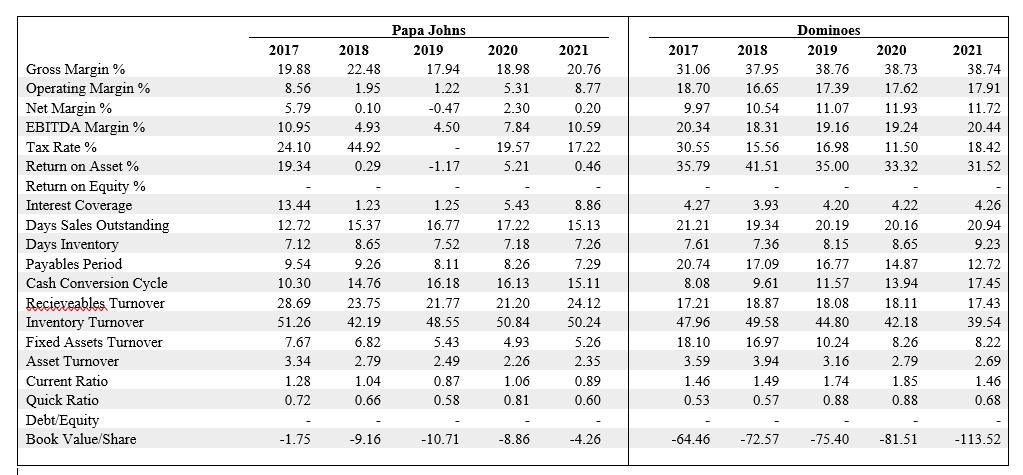
Using the financial information and business background provided on Domino’s and Papa John’s, answer the following questions. Keep in mind that you should first think about how each firm’s financials reflect their underlying business strategy. What do you see as the single (ONE ONLY) most significant difference in these firms’ business (not ratios)?
Revenues- 2021 2020 2019 Segment Income- 2021 2020 2019 Revenues: Total revenues Cost of sales: Cost of sales U.S. Stores Supply Chain 1,498,360 2,699,863 1,451,003 2,552,795 1,272,863 2,231,838 454,875 435,089 361,673 229,877 238,420 199,844 Operating Income General and administrative U.S. franchise advertising Income from operations Other Income Interest income Interest expense Income before provision for income taxes Provision for income taxes NET INCOME International Franchise. 298,036 249,757 240,975 241,873 197,602 187,318 Intersegment Revenue (138,886 ) (136,144 ) (126,902 ) Jan. 02, 2022 $ 4,357,373 2,669,131 1,688,242 428,333 479,501 780,408 36,758 345 (191,806) 625,705 115,238 $ 510,467 Other - (42,926 ) 883,699 (53,265 ) 817,846 (36,701 ) 712,134 Jan. 03, 2021 $4,117,411 2,522,918 1,594,493 406,613 462,238 725,642 Total 4,357,373 4,117,411 3,618,774 0 1,654 (172,166) 555,130 63,834 $ 491,296 Dec. 29, 2019 $ 3,618,774 2,216,275 1,402,499 382,293 390,799 629,407 0 4,048 (150,818) 482,637 81,928 $ 400,709
Step by Step Solution
3.42 Rating (155 Votes )
There are 3 Steps involved in it
Step: 1
Based on the information provided the most significant difference in Dominos and Papa Johns busine...
Get Instant Access to Expert-Tailored Solutions
See step-by-step solutions with expert insights and AI powered tools for academic success
Step: 2

Step: 3

Ace Your Homework with AI
Get the answers you need in no time with our AI-driven, step-by-step assistance
Get Started


