 Done in Java
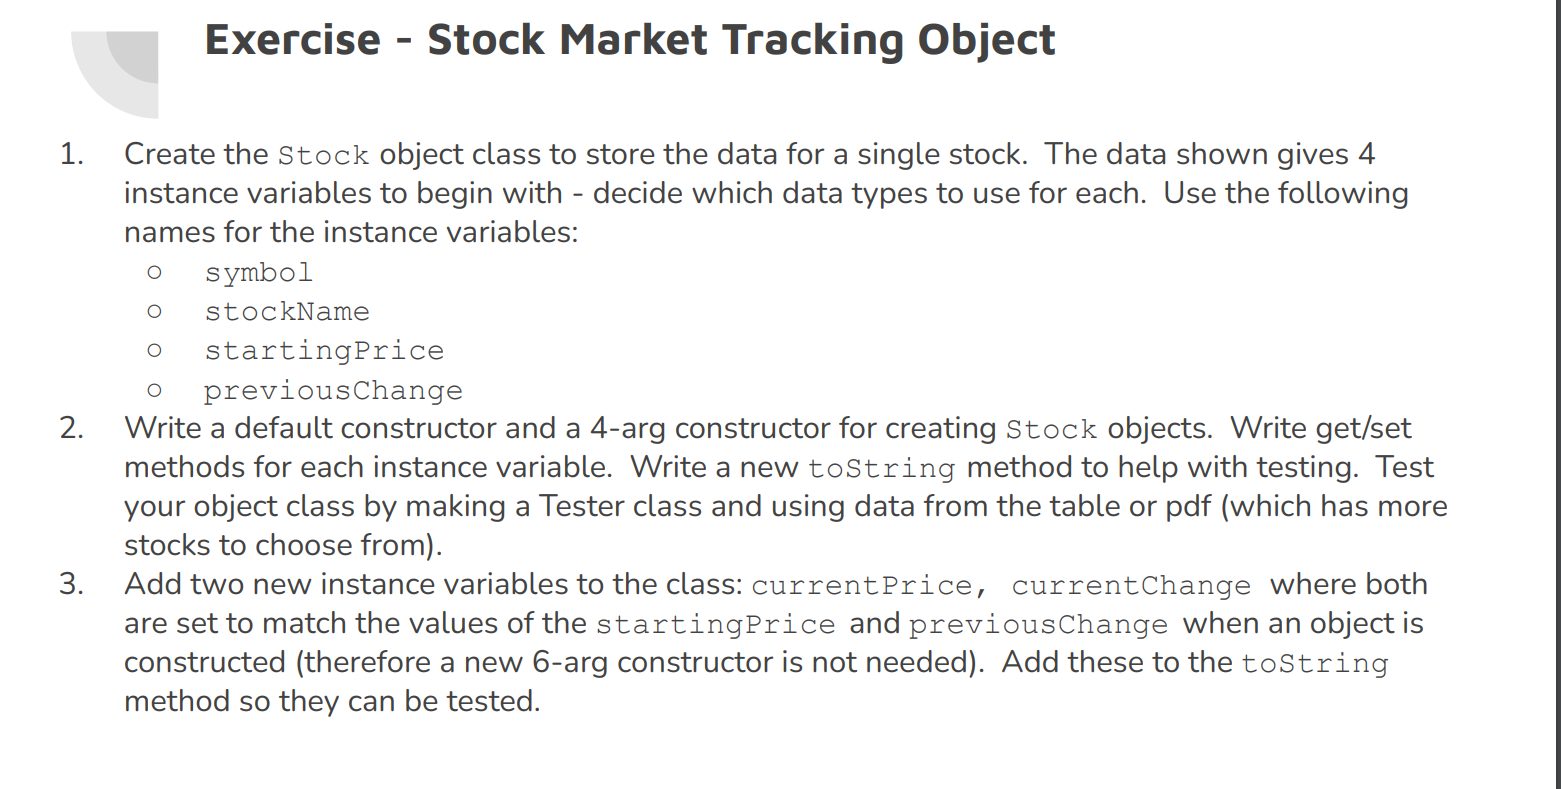
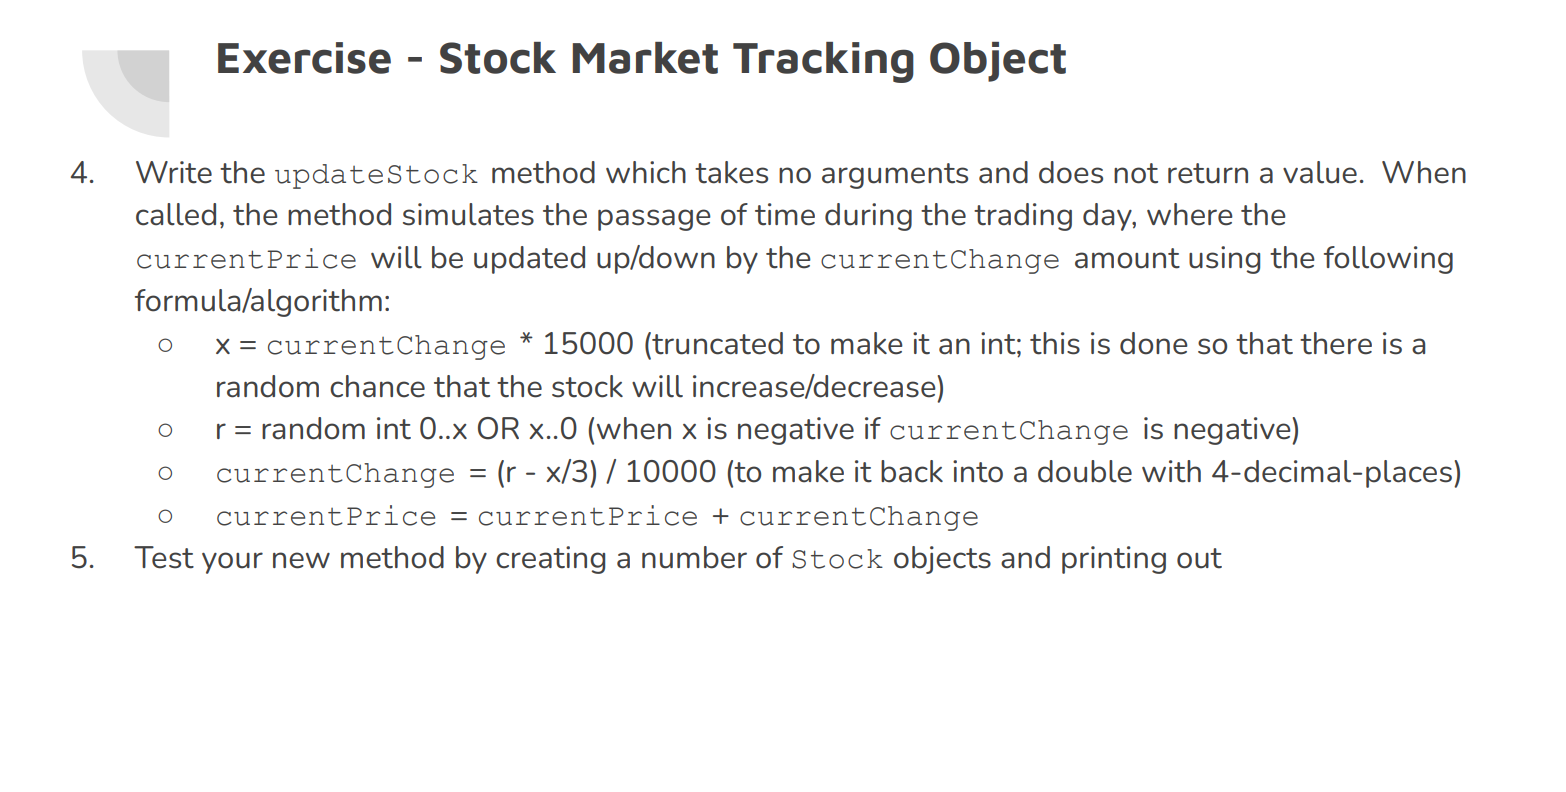
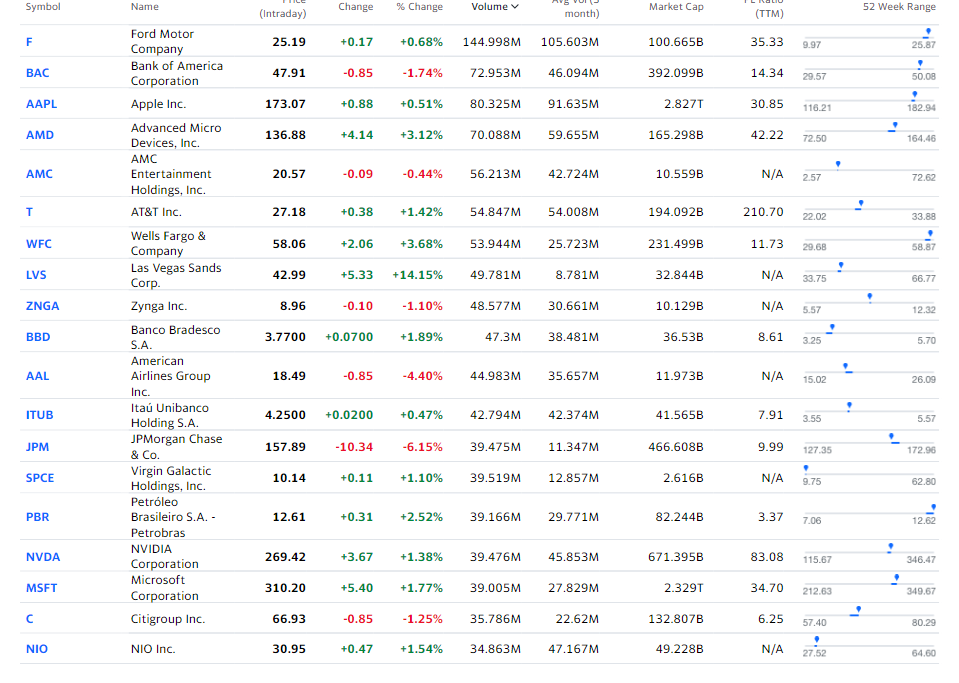
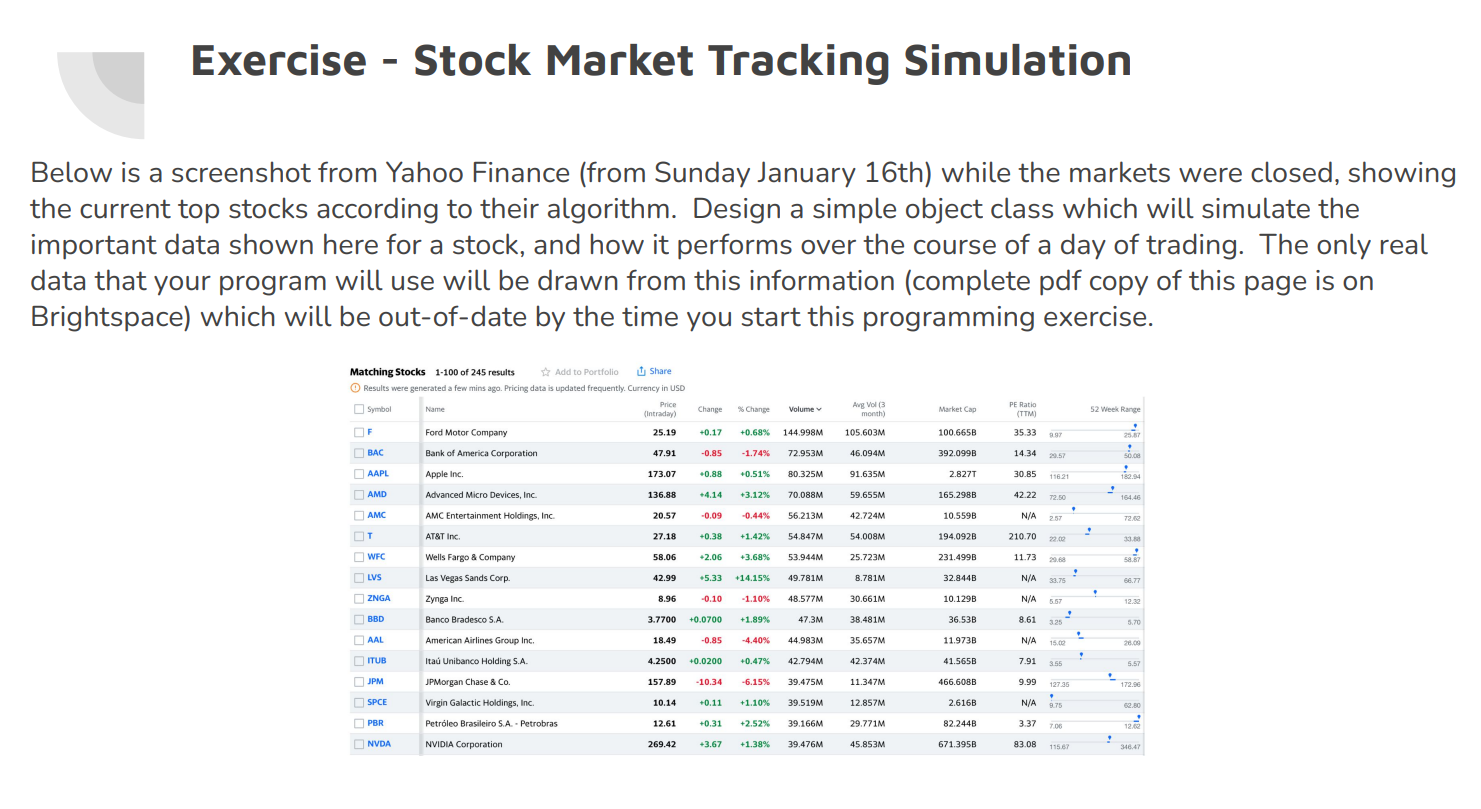
Symbol Name Change % Change Volume Market Cap 52 Week Range (Intraday) month) (TTM) F 25.19 +0.17 +0.68% 144.998M 105.603M 100.665B 35.33 9.97 25.87 BAC 47.91 -0.85 -1.74% 72.953M 46.094M 392.099B 14.34 29.57 50.08 AAPL 173.07 +0.88 +0.51% 80.325M 91.635M 2.8271 30.85 116.21 182.94 AMD 136.88 +4.14 +3.12% 70.088M 59.655M 165.298B 42.22 72.50 164.46 AMC 20.57 -0.09 -0.44% 56.213M 42.724M 10.559B N/A 2.57 72.62 T 27.18 +0.38 +1.42% 54.847M 54.008M 194.092B 210.70 22.02 33.88 WFC 58.06 +2.06 +3.68% 53.944M 25.723M 231.499B 11.73 29.68 58.87 LVS 42.99 +5.33 +14.15% 49.781M 8.781M 32.844B N/A 33.75 66.77 ZNGA 8.96 -0.10 -1.10% 48.577 M 30.661M 10.129B N/A 5.57 12.32 Ford Motor Company Bank of America Corporation Apple Inc. Advanced Micro Devices, Inc. AMC Entertainment Holdings, Inc. AT&T Inc. Wells Fargo & Company Las Vegas Sands Corp. Zynga Inc. Banco Bradesco S.A. American Airlines Group Inc. Ita Unibanco Holding S.A. JPMorgan Chase & Co. Virgin Galactic Holdings, Inc. Petrleo Brasileiro S.A. - Petrobras NVIDIA Corporation Microsoft Corporation Citigroup Inc. BBD 3.7700 +0.0700 +1.89% 47.3M 38.481M 36.53B 8.61 3.25 5.70 AAL 18.49 -0.85 -4.40% 44.983M 35.657M 11.973B N/A 15.02 26.09 ITUB 4.2500 +0.0200 +0.47% 42.794M 42.374M 41.565B 7.91 3.55 5.57 JPM 157.89 -10.34 -6.15% 39.475M 11.347M 466.608B 9.99 127.35 172.96 SPCE 10.14 +0.11 +1.10% 39.519M 12.857M 2.616B N/A 9.75 62.80 PBR 12.61 +0.31 +2.52% 39.166M 29.771M 82.244B 3.37 7.06 12.62 NVDA 269.42 +3.67 +1.38% 39.476M 45.853M 671.395B 83.08 115.67 346.47 MSFT 310.20 +5.40 +1.77% 39.005M 27.829M 2.3291 34.70 212.63 349.67 66.93 -0.85 -1.25% 35.786M 22.62M 132.807B 6.25 57.40 80.29 NIO NIO Inc. 30.95 +0.47 +1.54% 34.863M 47.167M 49.228B N/A . 27.52 64.60 - Exercise - Stock Market Tracking Simulation Below is a screenshot from Yahoo Finance (from Sunday January 16th) while the markets were closed, showing the current top stocks according to their algorithm. Design a simple object class which will simulate the important data shown here for a stock, and how it performs over the course of a day of trading. The only real data that your program will use will be drawn from this information (complete pdf copy of this page is on Brightspace) which will be out-of-date by the time you start this programming exercise. Matching Stocks 1-100 of 245 results Add to Portfolio Share Results were generated a few mins ago. Pricing data is updated frequently. Currency in USD Symbol Name Price (Intraday) Change % Change Volume Avg Volca month) Market Cap PE Ratio (TTM 52 Week Range F Ford Motor Company 25.19 +0.17 +0.68% 144.998M 105,603M 100.665B 35.33 39 25.87 BAC Bank of America Corporation 47.91 -0.85 -1.74% 72.953M 46.094M 392.099B 14.34 29.57 50.08 AAPL Apple Inc. 173.07 -0.88 +0.51% 80.325M 91.635M 2.827T 30.85 11621 182.94 AMD Advanced Micro Devices, Inc 136.88 +4.14 +3.12% 70.088M 59.655M 165.298B 42.22 72.50 164.46 AMC AMC Entertainment Holdings, Inc 20.57 -0.09 -0.44% 56.213M 42.724M 10.559B N/A 257 72.62 IT AT&T Inc. 27.18 +0.38 +1.42% 54.847M 54.00AM 194.092B 210.70 220 WFC 58.06 +2.06 +3.68% 53.944M 25.723M 231.499B 11.73 29.68 58.87 Wells Fargo & Company Las Vegas Sands Corp. . LVS 42.99 -5.33 +14.15% 49.781M 8.781M 32.844B N/A 33.75 66.77 ZNGA Zynga Inc 8.96 -0.10 -1.10% 48.577M 30.661M 10.129B N/A 5.57 12.32 BBD 3.7700 +0.0700 +1.89% 47.3M 38.481M 36.53B 8.61 325 5.70 Banco Bradesco S.A. American Airlines Group Inc. . AAL 18.49 -0.85 -4.40% 44.983M 35.657M 11.973B N/A 15.00 28.00 ITUB 4.2500 +0.0200 +0.47% 42.794M 42.374M 41.565B 7.91 3.55 5.57 Ita Unibanco Holding S.A. JPMorgan Chase & Co. JPM 157.89 -10.34 -6.15% 39.475M 11.347M 466.60BB 9.99 127:35 172.90 SPCE Virgin Galactic Holdings, Inc. 10.14 +0.11 +1.10% 39.519M 12.857M 2.616B N/A . 9.75 62.80 PBR Petrleo Brasileiro S.A. - Petrobras 12.61 +0.31 +2.52% 39.166M 29.771M 82.244B 3.37 7.06 122 NVDA NVIDIA Corporation 269.42 -3.67 +1.38% 39.476M 45.853M 671.3958 83.08 115.67 348.47 Exercise - Stock Market Tracking Object O O O O 1. Create the stock object class to store the data for a single stock. The data shown gives 4 instance variables to begin with - decide which data types to use for each. Use the following names for the instance variables: symbol stockName startingPrice previousChange 2. Write a default constructor and a 4-arg constructor for creating Stock objects. Write get/set methods for each instance variable. Write a new toString method to help with testing. Test your object class by making a Tester class and using data from the table or pdf (which has more stocks to choose from). 3. Add two new instance variables to the class: currentPrice, currentChange where both are set to match the values of the startingPrice and previousChange when an object is constructed (therefore a new 6-arg constructor is not needed). Add these to the toString method so they can be tested. a Exercise - Stock Market Tracking Object 4. O Write the updateStock method which takes no arguments and does not return a value. When called, the method simulates the passage of time during the trading day, where the current Price will be updated up/down by the currentChange amount using the following formula/algorithm: x = currentChange * 15000 (truncated to make it an int; this is done so that there is a random chance that the stock will increase/decrease) r = random int 0..x OR x..O (when x is negative if currentChange is negative) currentChange = (r - x/3) / 10000 (to make it back into a double with 4-decimal-places) currentPrice = currentPrice + currentChange Test your new method by creating a number of Stock objects and printing out O O - 5. Exercise - Stock Market Tracking Object For example, if the stock data for Apple is used from the table (shown in italics below), and Math.random () returns 0.67890123 when the random value is calculated, then the calculations show that Apple stocks continued to increase in value by over 40 cents: O = O x= +0.88 * 15000 = 13200 r = random value [O .. 13200] = 8961 currentChange = (8961 - 13200/3) / 10000 = +0.4561 current Price = 173.07 + 0.4561 = 173.52 O = O = For example, if the stock data for Zynga is used from the table (shown in italics below), and Math.random() returns 0.1234789 when the random value is calculated, then the calculations show that Zynga stocks have turned their losses around and is now increasing slightly by 3 cents: O O x= -0.10 * 15000 = -1500 r= random value (-1500 .. 0] = -185 currentChange = (-185 - (-1500/3)) / 10000 = +0.03147816 currentPrice = 8.96 + 0.03147816 = 8.99 - = =